Figure 1.
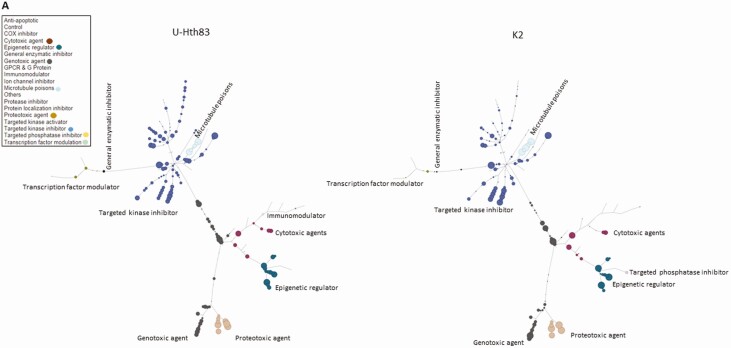
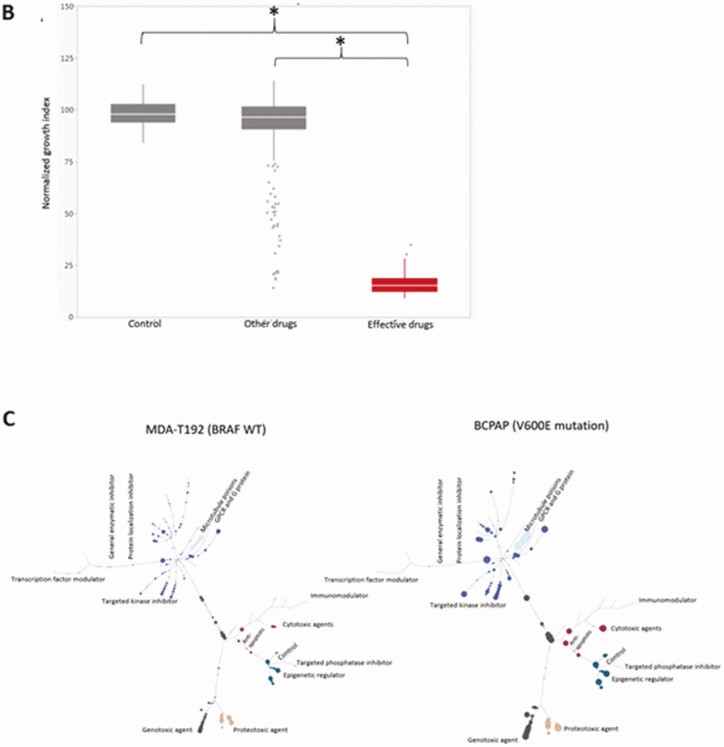
Analysis of HTS. (A) Tree analysis for U-Hth83 (left) and K2 (right) cells after HTS where the size of the colored data point dots represents relative effectiveness of each individual agent. A larger the dot indicates an increased effect. Each class with major effects were color coded for easier identification. (B) Boxplots of effective drugs in the initial screen at 0.1 μM concentration compared with DMSO (Control), other ineffective drugs, and the effective drugs. *P < 0.0001 for both. (C) A comparison of the activities of different classes of agents using tree analysis in a BRAFWT (MDA-T192) vs BRAFV600E mutated BRAF cell line (BCPAP).


