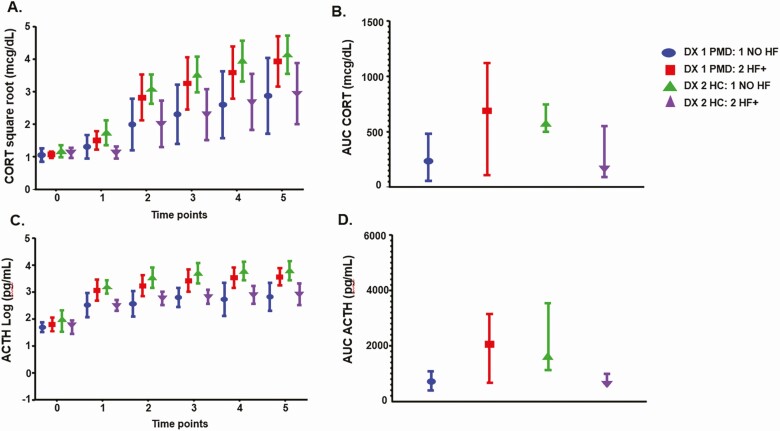
Figure 2.
A and B, the interactive effects of hot flushes on stimulated cortisol (CORT); and C and D, adrenocorticotropin (ACTH) during dexamethasone (DEX)-suppressed corticotropin-releasing hormone (CRH)-stimulation tests in women with perimenopausal depression (n = 20) and control women (n = 20). There was a significant interaction between diagnosis (perimenopausal depression [PMD] vs control women) and the presence or absence of hot flashes (HF) in the individual time points after CRH administration both for plasma CORT and ACTH levels (diagnosis by HF interaction: cortisol [P = .008], ACTH [P = .0002]; diagnosis by HF by time interaction: CORT [P = .08], ACTH [P = .03]), as well as the areas under the curve (AUCs; diagnosis by HF interaction: CORT [P = .02], ACTH [P = 0.001]). There also were no significant main or interactive effects of HFs and diagnosis in urinary free CORT (UFC) levels (main effect of HF: P = .82; HF by Dx interaction: P = .83). This study was not powered to evaluate diagnosis by HF interactions, and 14 of the 20 women with PMD, but only 7 of 20 control women reported HFs. A total of 24 post hoc pairwise comparisons were performed (4 pairwise comparisons in 6 separate time points for each of the CORT and ACTH values). Thus, those comparisons with P greater than .002 (=0.05/24) should not be considered significant. In women with PMD, the presence of HF did not alter the CORT response to CRH, but was accompanied by an increased ACTH response to CRH, although none of the post hoc P values met the threshold (P < .002) to be considered significant (t = 15, 30, 45, 60, and 75 minutes: CORT—P values = .39, .12, .12, .13, and .13; ACTH—P values = .07, .03, .03, .34, and .02). Second, in control women, in contrast to the women with PMD, the presence of HFs was accompanied by a decreased CORT and ACTH response to CRH administration (t = 15, 30, 45, 60, and 75 minutes: CORT—P values = .006, .02, .01, .02, and .04; ACTH—P values = .0001, .002, .0005, .0007, and .003) with the qualifier that none of the CORT values met significance at P less than .002. Comparing across diagnoses within each HF group, in those women with HFs, women with PMD had increased CORT and ACTH compared with control women—although none of the P values met the criterion for significance of P less than .002 (t = 15, 30, 45, 60, and 75 minutes: CORT—P values = .03, .11, .09, .13, and .11; ACTH—P values = .01, .05, .09, .02, and .02). In those women without HFs, women with PMD had decreased CORT and ACTH compared with control women—although none of the P values met the criterion for significance of P less than .002 (t = 15, 30, 45, 60, and 75 minutes: CORT— P values = .10, .02, .03, .03, and .06; ACTH—P values = .01, .003, .001, .005, and 0.004). Post hoc testing of the areas under the curve (AUCs) CORT and ACTH showed a similar pattern of effects. A total of 4 pairwise comparisons were performed for each of the CORT and ACTH values, and, therefore, those comparisons with P greater than .0125 (=0.05/4) should not be considered significant. Women with PMD did not have significantly different AUCs of cortisol or ACTH (P = .13 and .16, respectively) regardless of the presence of absence of HFs. Control women with HFs had decreased AUCs of CORT and ACTH compared to those without HFs (P = .03 and .02, respectively), although none of the P values met the criterion for significance of P less than .0125. Additionally, in the women with no HFs, women with PMD had decreased AUC ACTH compared with control women (P = .03), again not meeting the criterion of a P equal to .0125 level of significance. Otherwise there were no significant effects of HFs in control women (HF present—PMD vs control women: CORT AUC P = .15, ACTH AUC P = .07; no HFs—PMD vs control women: CORT AUC P = .12). Values for CORT are square root–transformed and those for ACTH are log-transformed. Values in A and B are least squares means ± 95% CI, values in C and D are median and interquartile range. For the repeated measures (baseline average to 75 minutes), linear mixed models were used on the square root–transformed CORT and log-transformed ACTH; the P values were obtained for each time point in the model. For all other variables, the Wilcoxon rank sum test was used.

