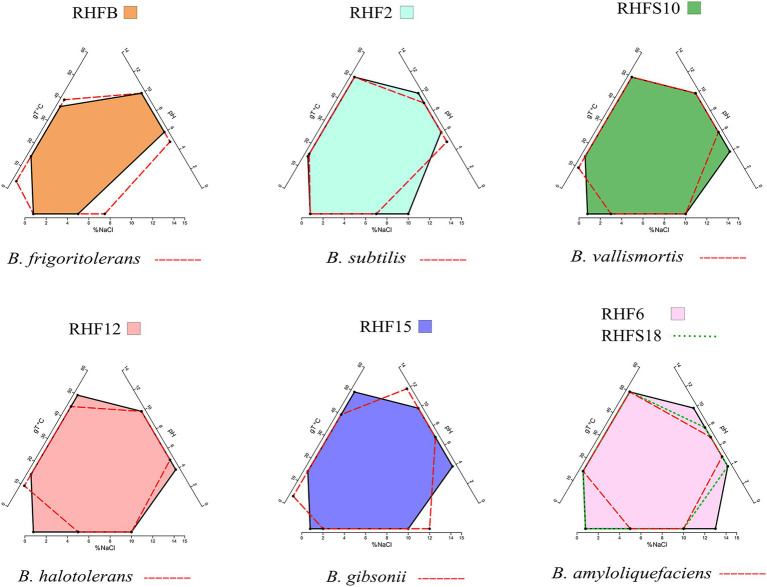
Figure 2.
Phenotypic plasticity of the salt-pan isolates. Multivariate polygons plots (Giovannelli et al., 2021, in preparation) showing the growth temperature (gT°C), pH, and salinity (% NaCl) boundaries observed for the seven isolates (polygons) and the range for the closest relative identified by ANI (red dashed lines). Each edge represents the range for the specific variables projected onto the axis. More information about polygons plot can be found at https://giovannellilab.github.io/polygonsplot/.

