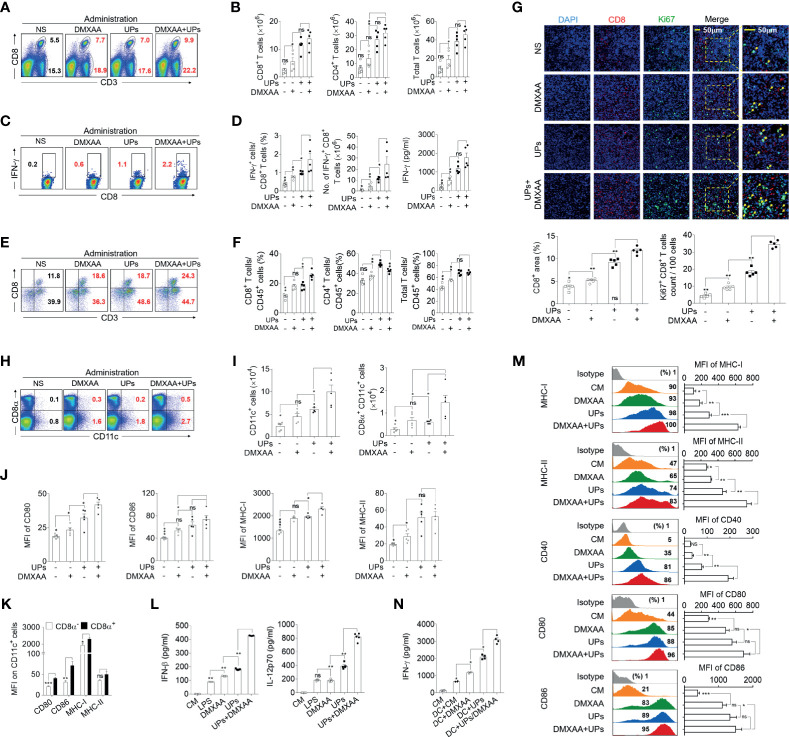
Figure 6.
5,6-Dimethylxanthenone-4-acetic acid (DMXAA) enhanced the anti-tumor effect of ubiquitinated proteins (UPs)-4T1/epirubicin (EPB) nanovaccine through the activation, maturation, and lymph node migration of CD8α+ dendritic cells (DCs). The mice (n = 5 to 6 per group) were challenged with 5 × 10⁵ 4T1/EPB cells s.c. on day 0 and received an i.v. injection of EPB on day 5. The mice received a s.c. vaccination of UPs-4T1/EPB nanovaccine alone or combined with DMXAA three times on days 14, 16, and 18. The mice were euthanized on day 21, and their draining lymph nodes (DLNs), spleens, and tumor tissues were collected for the subsequent experiments. (A, B) The representative flow cytometric plots of CD8+ T cells, CD4+ T cells, and total T cells in spleens (A) and the absolute numbers were calculated (B). (C, D) The splenocytes were restimulated with inactivated 4T1/EPB cells for 24 h. Representative flow cytometric plots of IFN-γ+ CD3+ CD8+ T cells (C). The percentage of IFN-γ+ CD3+ CD8+ T cells was examined by flow cytometry, and the absolute numbers were calculated. The total IFN-γ level in the cell supernatant was detected by ELISA (D). (E, F) Half of each tumor was isolated and processed to a single-cell suspension. Representative flow cytometric plots (E). The percentage (F) of total T lymphocytes (CD45+ CD3+ cells) and T cell subsets (CD45+ CD3+ CD8+ T cells and CD45+ CD3+ CD8- T cells) was detected using flow cytometry. (G) Immunofluorescence microscopy images of DAPI (blue), CD8 (red), Ki67 (green), and merged in the remaining half tumor. The CD8+ T cell infiltration area was evaluated using Image J Absolute numbers of Ki67+ CD8+ T cells were counted in 100 cells per field from five different fields. (H, I) Representative flow cytometric plots (H) and absolute numbers (I) of total DCs and CD8α+ dendritic cells (DCs) in DLNs. (J) The mean fluorescence intensity (MFI) values of CD80, CD86, and MHC class I and II on CD8α+ DCs from different groups. (K) The MFI values of CD80, CD86, and MHC class I and II on CD8α - DCs and CD8α+ DCs from UPs-4T1/EPB plus the DMXAA group. (L, M) Bone marrow-derived DCs (BMDCs) were cultured with DMXAA, UPs (4T1/EPB), and DMXAA plus UPs (4T1/EPB) after 24 h. IFN-β (top) and IL-12p70 (bottom) were measured in the culture supernatants by ELISA (L). Expression analysis of MHC class I and II, CD40, CD80, and CD86 on BMDCs by flow cytometry (M). (N) Splenocytes from UPs-4T1/EPB vaccinated mice were co-cultured with BMDCs from different groups in (M) for 12 h, and the IFN-γ secretion in the supernatant was examined by ELISA. Splenocytes alone and splenocytes cocultured with untreated BMDCs served as the controls. P-values were determined by Mann–Whitney U-test. The results are representative of three independent experiments, and data were expressed as means ± SEM (*p < 0.05; **p < 0.01; ***p < 0.001; ns, not significant); P <0.05 was considered significant. All data are presented as mean ± SEM.

