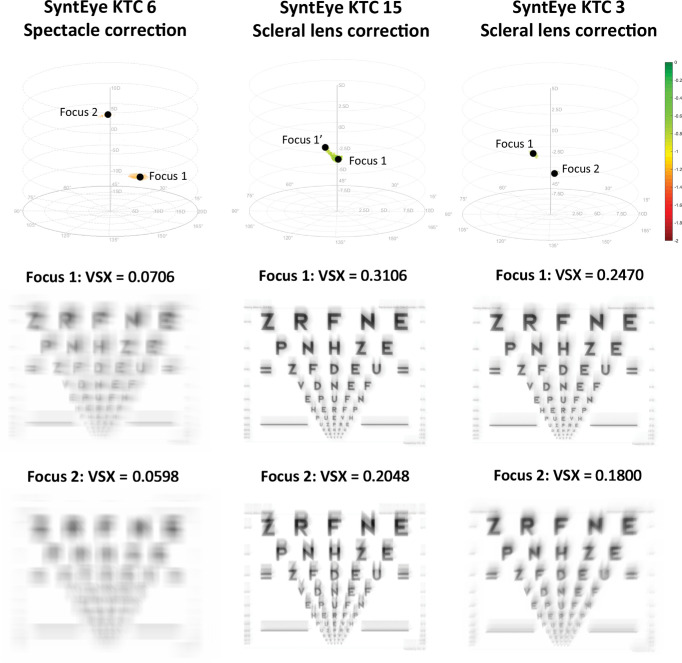
Figure 4.
Simulated logarithm of the minimum angle of resolution charts illustrating the visual quality in the two foci in correction space for the spectacle correction of SyntEye KTC 15 (first column), the scleral lens correction of SyntEye KTC 15 (second column), and the scleral lens correction of SyntEye KTC 3 (third column).

