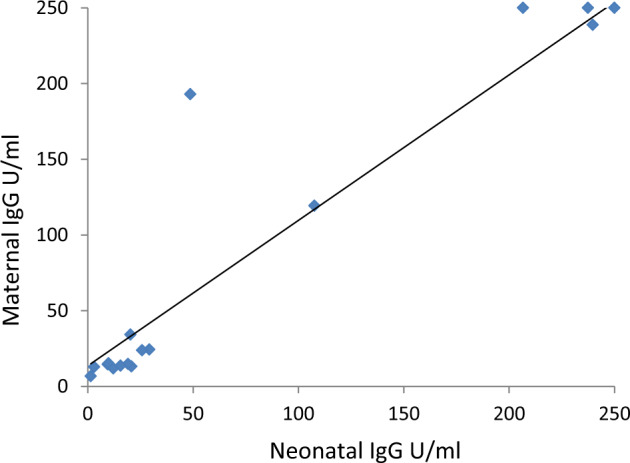
Fig. 1. Correlation between the maternal and neonatal antibody titers.

Maternal-fetal serological correlation of IgG for ‘S’ protein. Correlations between fetal and 30 maternal Antibodies were analyzed by Linear Regression test. Each dot represents data from a single pair of maternal and neonatal ‘S’ protein antibodies titer; the linear regression line is marked in black, with its 95% CI (dotted lines). R2 = 0.94, p < 0.05.
