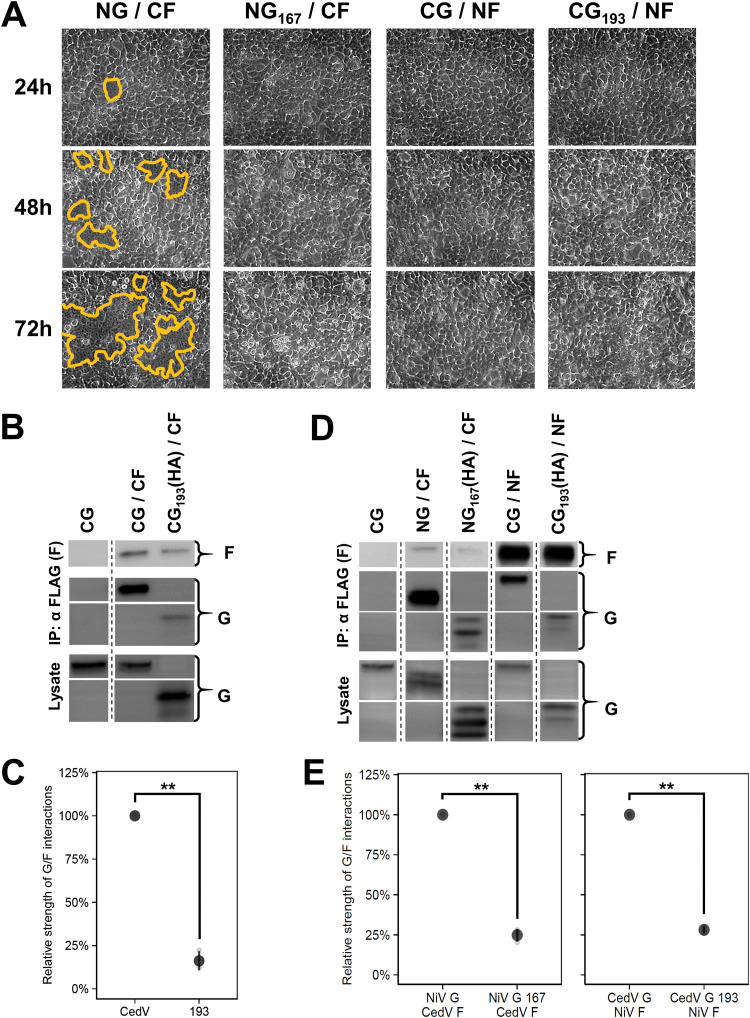
FIG 5.
Heterotypic assays between NiV and CedV glycoproteins reveal heterotypic bidentate interactions. (A) Representative fusion images (syncytia outlined in yellow) of heterotypic G/F combinations in HEK 293T cells. Cells were imaged every 24 hpt and fusion was only observed for NG/CF. (B) Representative blots of interactions between wild-type or headless CedV G and CedV F (24 hpt). The leftmost lanes represent the co-IP negative control. (C) Relative strength of G/F interactions between wild-type or headless CedV G with CedV F normalized to wild-type CedV G set to 100% (mean ± SD, n = 3). Relative G/F interaction strength was defined as ([GIP/GLysate] × FIP). Panels D and E are experimentally identical to panels B and C except for the use of heterotypic transfections as performed in A (48 hpt). All signals were obtained from the same blot, but the lanes were not necessarily adjacent. Gray points in the plots represent individual data points.

