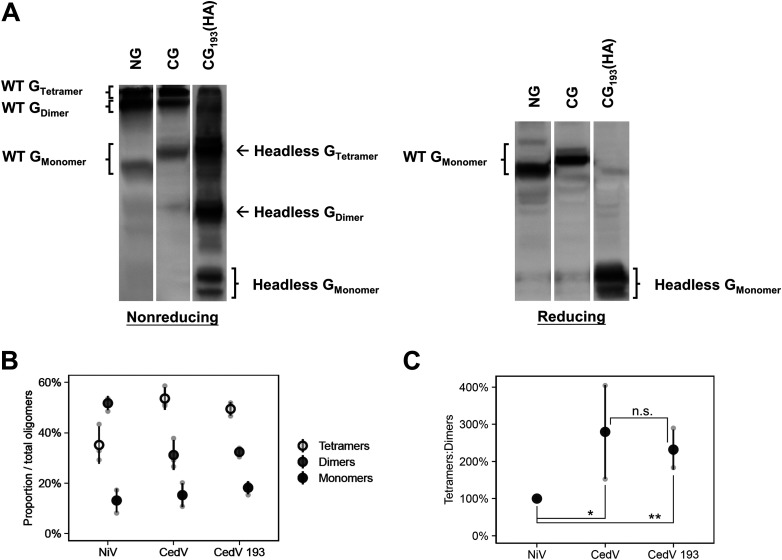
FIG 6.
CedV G forms a higher proportion of tetramers:dimers than NiV G. (A) Representative nonreducing and reducing blots of wild-type NiV G, wild-type CedV G, and headless CedV G (24 hpt). (B) Oligomerization of the proteins (mean ± SD, n = 3); percent oligomers was defined as the percentage of (Goligomer/Gtetramer+dimer+monomer). (C) Ratios of tetramers:dimers of the G proteins normalized to that of NiV G set to 100%. All signals were obtained from the same blot, but the lanes were not necessarily adjacent. Gray points in the plots represent individual data points.

