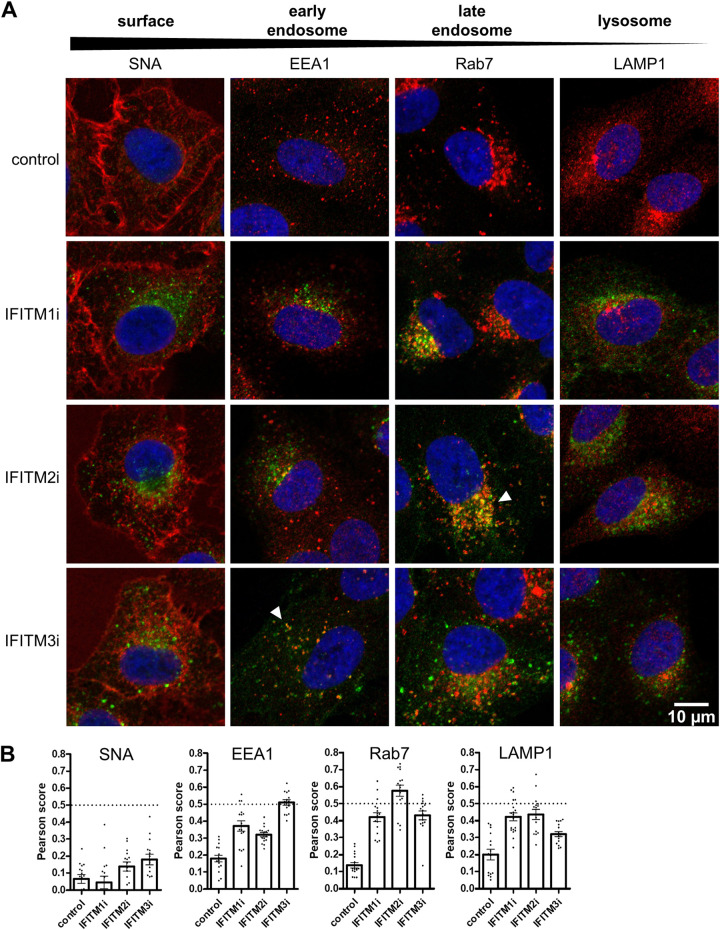
FIG 3.
Localization of inducible IFITM1, IFITM2, and IFITM3 proteins expressed in A549 cells. Control, IFITM1i, IFITM2i, or IFITM3i A549 cells were cultured in the presence of DOX for 24 hours to induce IFITM expression before cells were fixed and stained with an anti-FLAG antibody in conjunction with Alexa Fluor-488-conjugated antibody (green). (A) Cellular compartments were visualized by staining with SNA (cell surface), EEA1 (early endosomes), Rab7 (late endosomes), or LAMP1 (lysosomes) antibodies in conjunction with Alexa Fluor-647-conjugated antibody (red). White arrows indicate areas of colocalization between FLAG staining and SNA, EEA1, Rab7, or LAMP1 staining. Nuclei were stained with DAPI (blue). Images were acquired at ×63 magnification. (B) The Pearson’s coefficient (R) value was calculated between signals in the green and red channels (from at least 15 cells for each sample). The dotted line at 0.5 represents the threshold for colocalization. Mean values are presented as a bar graph, and error bars represent SEM. Control A549 cells express an irrelevant inducible protein without a FLAG-tag.

