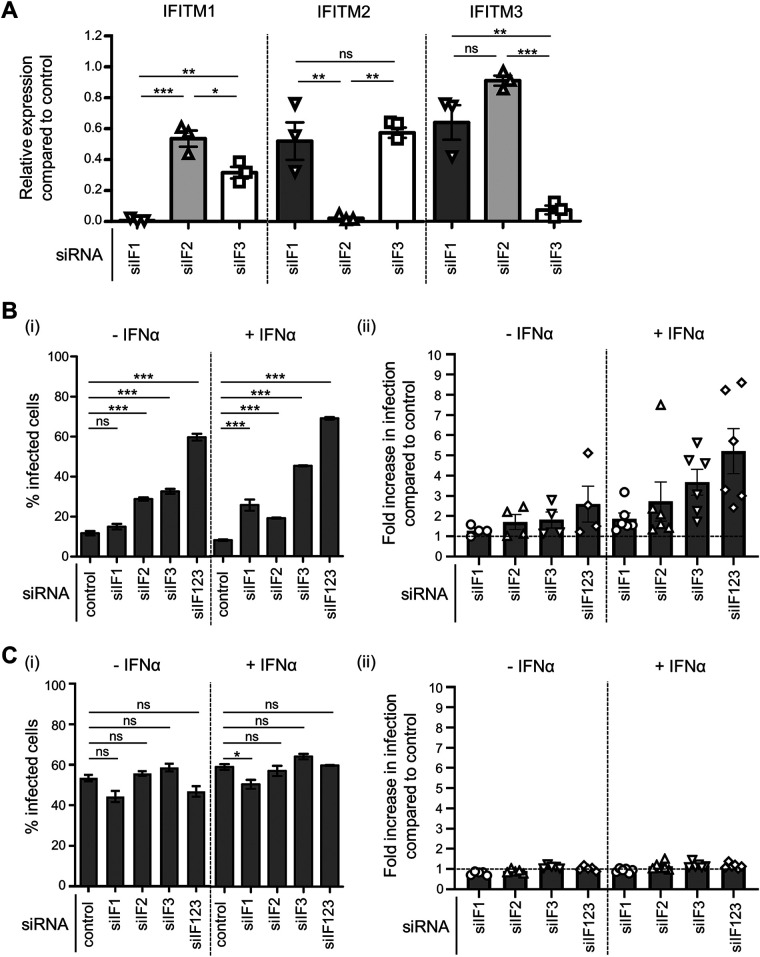
FIG 6.
siRNA knockdown of endogenous IFITM1, IFITM2, and IFITM3 in A549 cells. (A) Quantitation of IFITM1, IFITM2, and IFITM3 mRNA in A549 cells treated with siRNA targeting IFITM1 (siIF1), IFITM2 (siIF2), or IFITM3 (siIF3) or nontargeting siRNA (control). A549 cells were transfected with 5 nM siRNA for 72 hours, including during overnight treatment with IFN-α prior to RNA isolation. Expression of each IFITM gene was normalized to the expression of GAPDH. The relative expression levels of IFITM1, IFTIM2, and IFITM3 mRNA in siIF-treated A549 cells compared with those of control-siRNA treated A549 cells are shown. Data are pooled from three independent experiments performed in triplicate. (Bi) A549 cells were treated with siIF1, siIF2, siIF3, pooled siRNA (siIF123), or control siRNA and 48 hours later were incubated in the presence (+IFN-α) or absence (−IFN-α) of IFN-α for an additional 18 to 24 hours. After being washed, cells were then infected with IAV at an MOI of 1 in the absence of IFN-α or at an MOI of 10 in the presence of IFN-α, such that similar baseline levels of infection were obtained in the presence or absence of IFN-α. The percentage of infected cells was determined by staining with anti-IAV NP at 8 hpi. Data are representative of four independent experiments performed in triplicate. Error bars depict SEM. (***, P ≤ 0.001; **, P ≤ 0.01; *, P ≤ 0.05; ns, P > 0.05; significance by one-way analysis of variance [ANOVA] with Tukey’s multiple comparative analysis). (Bii) Fold increase in IAV infection between A549 cells treated with IFITM-specific siRNA compared with infection levels in cells treated with control siRNA (dotted line). Data were pooled from four independent experiments performed in triplicate. Error bars represent SEM. (Ci) A549 cells were treated with siIF1, siIF2, siIF3, pooled siRNA (siIF123), or control siRNA and 48 hours later were incubated in the presence (+IFN-α) or absence (−IFN-α) of IFN-α for an additional 18 to 24 hours. After washing, cells were then infected with PIV-3 at an MOI of 0.8 in the absence of IFN-α or at an MOI of 8 in the presence of IFN-α, such that similar baseline levels of infection were obtained in the presence or absence of IFN-α. The percentage of infected cells was determined by staining with anti-PIV-3 HN antibody at 18 hpi. Data are representative of four independent experiments performed in triplicate. Error bars depict SEM. (***, P ≤ 0.001; **, P ≤ 0.01; *, P ≤ 0.05; ns, P > 0.05; significance by one-way analysis of variance [ANOVA] with Tukey’s multiple comparative analysis). (Cii) Fold increase in PIV-3 infection between A549 cells treated with IFITM-specific siRNA compared with infection levels in cells treated with control siRNA (dotted line). Data were pooled from four independent experiments performed in triplicate. Error bars represent SEM.

