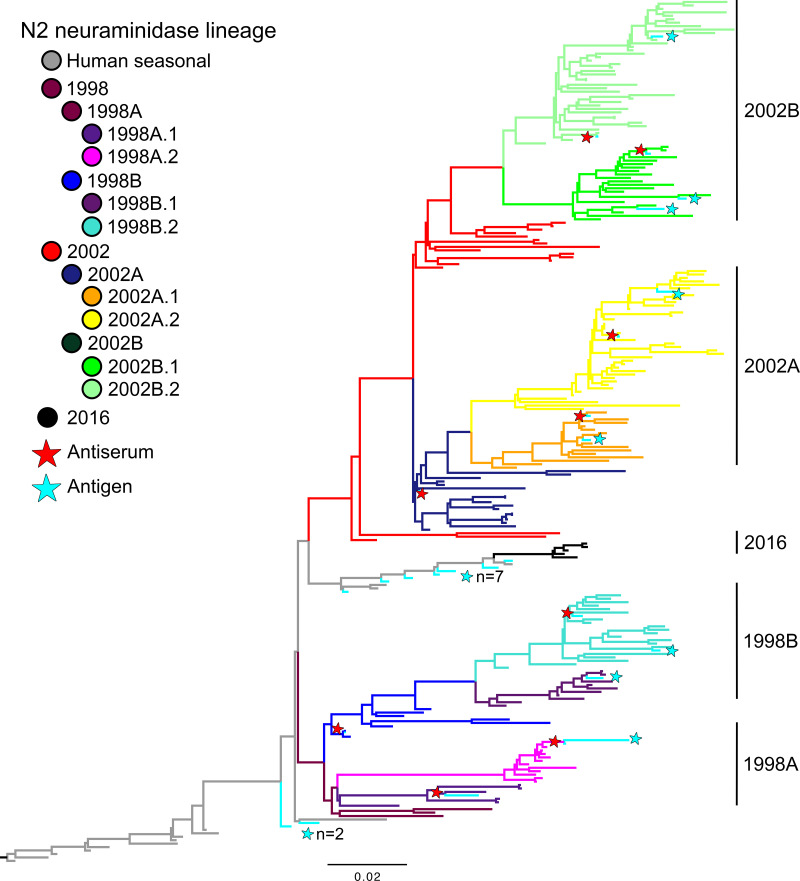
FIG 1.
Representative maximum-likelihood phylogeny of 250 swine and human N2 NA genes. The two major N2 lineages in swine are the result of independent introductions of N2 from humans to swine and are grouped by 1998 and 2002. Each lineage was divided into multiple statistically supported clades (denoted A, B, 1, and 2) for which the branches have been colored. Selected reference and test antigens are annotated by stars, and branches are colored cyan; human seasonal N2 NA genes are colored in gray. The tree is rooted on the human seasonal N2 gene A/Port Chalmers/1/1973 (H3N2); all branch lengths are drawn to scale, and the scale bar indicates the number of nucleotide substitutions per site. Multiple antigens residing in closely located branches are denoted by text to the right of the star indicating the number (n) of antigens in this area of the tree. The phylogeny with tip labels included is presented in the supplemental materials and available at https://github.com/flu-crew/n2-characterization.

