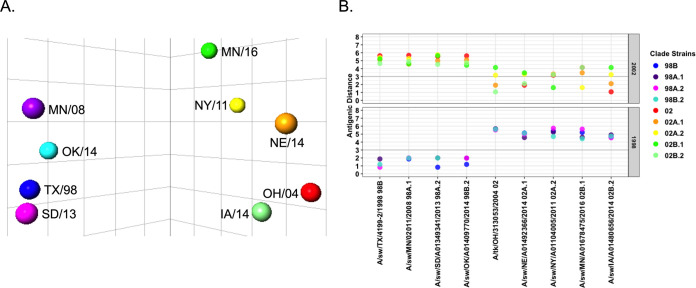
FIG 2.
Antigenic distance of reference swine N2. The NAI of swine N2 antisera against homologous, reference antigens was determined using the ELLA. Antigenic cartography was used to chart the NAI data in three dimensions and calculate antigenic distances between antigens. (A) Antigenic map of N2 antigens shows a large antigenic distance exists between 1998 and 2002 lineages. (B) Graphical representation of antigenic distances between reference antigens. Each antigen is listed on the x axis, and the distances to reference antigens of the 1998 lineage (bottom) and 2002 lineage (top) are represented by colored dots. Bold line indicates an antigenic distance of 3 AU.

