Abstract
The lipid chemoattractant sphingosine 1-phosphate (S1P) guides cells from the low-S1P environment of tissues into the high-S1P environment of circulatory fluids(1). Notably, S1P directs T cell exit from lymph nodes (LN), where T cells are initially activated, into lymph, from which T cells reach blood and ultimately inflamed tissues(1). T cells follow S1P gradients primarily using S1P receptor 1 (S1PR1)(1). While recent work has described how S1P gradients are established at steady-state, little is known about S1P distribution in disease, or about how changing S1P levels may affect immune responses. Here, we find that S1P concentrations increase in LN during an immune response. Hematopoietic cells, including inflammatory monocytes (iMo), are an important source of this S1P, an unexpected finding as endothelial cells provide lymph S1P(1). iMo require the early activation marker CD69 to supply this S1P, in part because CD69 expression is associated with reduced levels of S1pr5. CD69 acts as a “stand-your-ground” signal, keeping immune cells at a site of inflammation by regulating both S1P receptors and S1P gradients. Finally, increased S1P prolongs T cell residence time in LN, and exacerbates the severity of experimental autoimmune encephalomyelitis. This finding suggests the hypothesis that LN residence time regulates T cell differentiation, and points to novel uses of drugs targeting S1P signaling.
Increased LN S1P in an immune response.
We first asked whether extracellular S1P in LN changes during an immune response. This question is challenging because S1P is a lipid, so levels cannot be approximated by mRNA(2). Moreover, S1P has intracellular and extracellular roles, making mass spectrometry of whole tissues uninformative(2). Even when extracellular fluid can be obtained, interpretation is complicated because S1P is carried by proteins that may sequester or present the lipid(3). The most reliable measurements of “signaling-available” S1P have been based on the observation that S1PR1 is internalized upon binding S1P(4). All else being equal, a cell with high surface S1PR1 is not sensing S1P, while a cell with low surface S1PR1 is sensing S1P. This inference has been extensively validated for T cells in homeostasis, but is problematic in inflammation, when additional factors regulate surface S1PR1(1)(E.D. Fig. 1a). Upon exposure to inflammatory cytokines or T cell receptor (TCR) activation, T cells upregulate CD69; CD69 binds S1PR1 and the CD69-S1PR1 complex is internalized(5,6). Moreover, TCR activation downmodulates S1pr1 transcription(1). These effects are transient however, leaving a large time window in which S1P might alter T cell trafficking.
To address whether LN S1P changes during an immune response, we transferred Cd69−/− polyclonal T cells to a WT host, induced inflammation by injection of the viral dsRNA mimic polyinosinic:polycytidylic acid (pIC), and measured surface S1PR1 on the transferred cells in the draining LN (dLN) (Fig. 1a). We observed reduced surface S1PR1, consistent with increased LN S1P (Fig. 1b–c; E.D. Fig. 1–2). To assess whether loss of S1PR1 was ligand-independent (beyond effects of CD69 and TCR signaling, avoided with Cd69−/− polyclonal T cells), we used mice expressing an S1P sensor(7,8). The sensor’s core is S1PR1 fused to GFP, which is internalized and partly degraded upon binding S1P. The sensor also encodes a mutant S1PR1 (S1PR1NB), with an arginine to alanine substitution that prevents S1P binding, fused to RFP. S1PR1NB-RFP stays on the cell surface regardless of extracellular S1P. The two receptors are linked by a 2A sequence, and hence transcribed and translated at a 1:1 ratio. The ratio of S1PR1-GFP to S1PR1NB-RFP on the cell surface is a measure of a cell’s S1P exposure (Fig. 1d). We transferred sensor-expressing Cd69−/− polyclonal T cells to WT hosts, induced inflammation with pIC, and visualized the transferred cells. Surface S1PR1-GFP was reduced relative to S1PR1NB-RFP (Fig. 1e–f, E.D. Fig. 1k). This suggested that S1PR1 internalization did not reflect transcriptional, translational, or most post-translational modifications, and likely indicated increased LN S1P (E.D. Fig. 2j).
Fig. 1: S1P increases in the dLN after pIC injection.
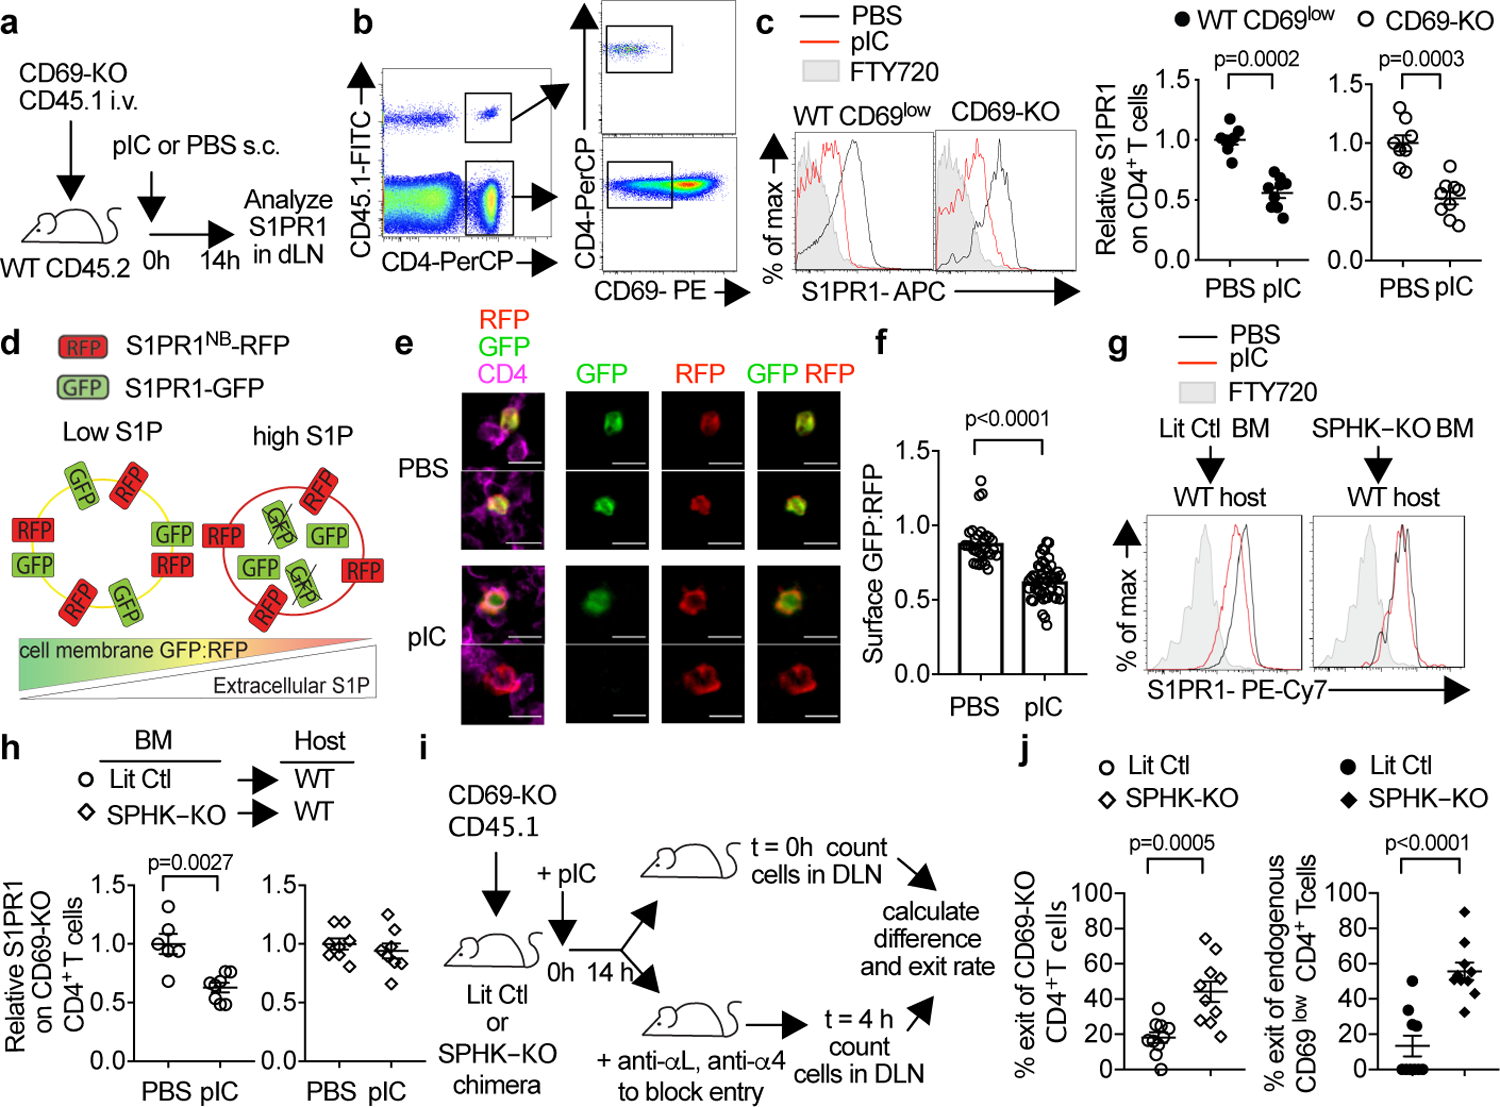
(a-c) (a) Experiment design. (b) Identification of CD69-KO cells (left). Gating of CD69low CD4+ T cells (center). Surface S1PR1 on endogenous (WT) CD69low or CD69-KO CD4+ T cells in dLN (right). FTY720-treated mouse served as negative control. (c) The S1PR1 mean fluorescence intensity (MFI) of endogenous CD69lowCD4+ cells in each mouse was divided by the mean S1PR1 MFI of endogenous CD69lowCD4+ cells in the PBS-treated group; the S1PR1 MFI of transferred CD69-KO CD4+ cells in each mouse was divided by the mean MFI of transferred cells in the PBS-treated group. 4 experiments. PBS (n=8); pIC (n=9). (d) S1P sensor design. (e-f) CD69-KO Sensor+ T cells were transferred i.v. into WT recipients. 24h later, mice were treated s.c. with PBS (n=7) or pIC (n=8). 14h later, dLN were analyzed. 5 experiments. (e) CD4+Sensor+ cells in the T zone, representative of cells in (f). Scale bar 10µm. (f) Quantification of S1P reporting in the T zone. Each point represents the average ratio of GFP:RFP on the CD4+RFP+ pixels (marking the surface of sensor-expressing cells) in an area ≥5.5 × 103 µm2 (PBS n=29; pIC n=50). (g-j) Irradiated UBC-GFP+ mice were reconstituted with pIC-treated Sphk1f/fSphk2−/−Mx1-Cre+ (SPHK-KO) or littermate control (LitCtl) BM, and analyzed 12–14 weeks later. (g,h) Chimeras analyzed as in (a-c). 3 experiments. LitCtl (PBS n=6, pIC n=8); SPHK-KO (PBS n=8, pIC n=8). (i) Experiment design. (j) % cells exiting the LN in 4h. Each point represents one mouse at t=4h relative to the average at t=0. 4 experiments. SPHK-KO (n=10 t=0, n=10 t=4h), LitCtl (n=10 t=0, n=10 t=4h). Mean +/− SEM. Mann-Whitney two-tailed t-test.
If the loss of surface S1PR1 were due to increased S1P, surface S1PR1 should be restored by inhibiting S1P synthesis. Mice that cannot produce S1P die at mid-gestation, so we made bone marrow (BM) chimeras in which WT hosts were reconstituted with BM from sphingosine kinase-deficient donors (SPHK-KO, Sphk1f/fSphk2−/−Mx1-Cre+) or littermate controls. Loss of S1P production by hematopoietic cells blocked S1PR1 internalization after pIC injection, indicating that a hematopoietic source supplied S1P in inflammation (Fig. 1g–h; E.D. Fig. 2k–p).
Last, if LN S1P increased, T cells should stay longer in the LN, because the increased LN S1P would counter lymph S1P directing exit. To test this, we transferred polyclonal Cd69−/− T cells into SPHK-KO and control BM chimeras, treated the mice with pIC, and waited 14h. We then divided the mice into two groups. We euthanized one group at “t=0” and counted T cells in the dLN. We treated the second group with LFA1- and VLA4-blocking antibodies, preventing further T cell entry into LN(9). We waited 4h, euthanized the second group of mice, and counted cells remaining in the dLN. While ~20% of cells exited control LN in 4h, ~50% exited LN of SPHK-KO chimeras (Fig 1i–j; E.D. Fig. 2q–r).
Inflammatory monocytes supply LN S1P.
Our next question was which cells supply LN S1P in inflammation. CD11b+CCR2+Ly6ChiLy6Glo iMo accumulated in dLN after pIC treatment (Fig. 2a–b; E.D. Fig. 3a–b)(10). Upon depletion of iMo and neutrophils with an antibody to Ly6C/G, we no longer observed S1PR1 internalization on T cells (Fig. 2c–d; E.D. Fig. 3c–h). This suggested that iMo might supply LN S1P during an immune response.
Fig. 2: iMo supply LN S1P.
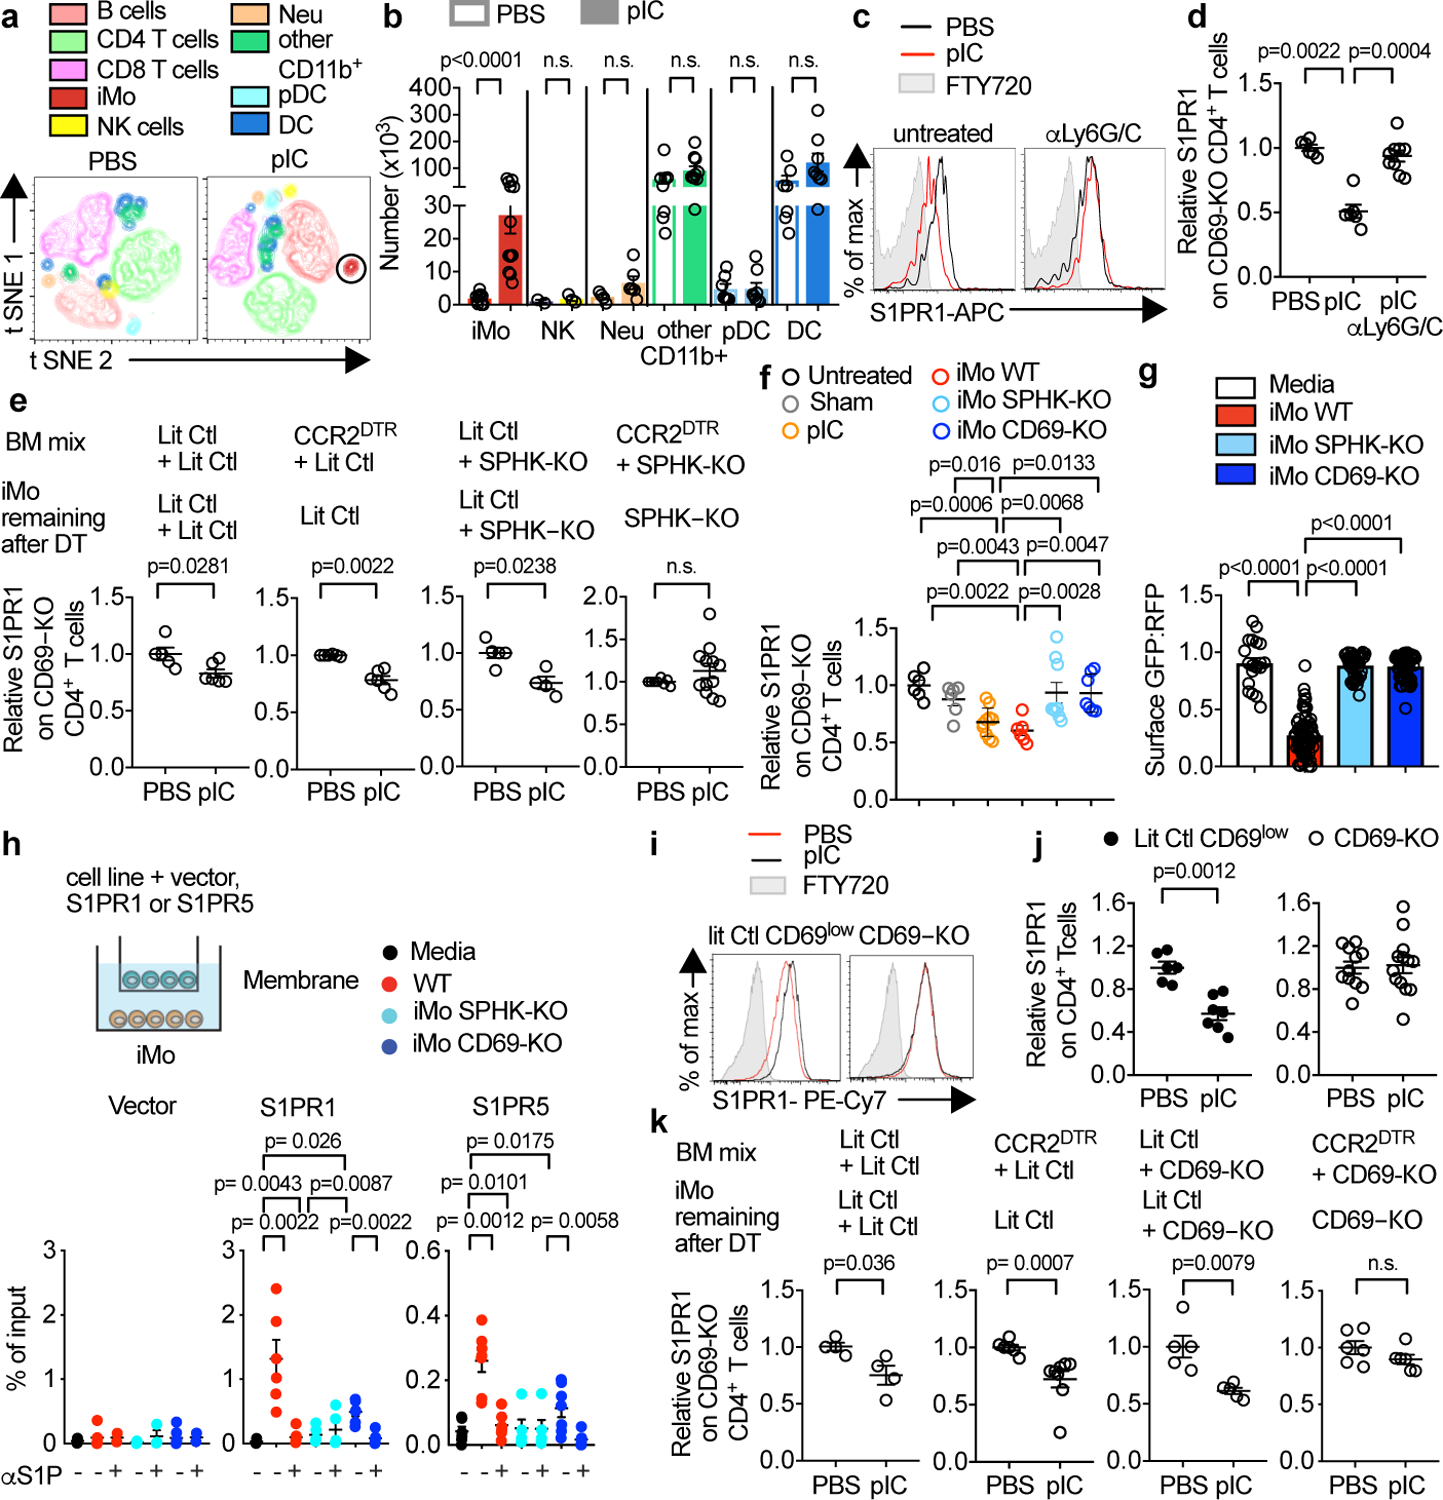
(a,b) WT mice were injected s.c. with PBS or pIC, and dLN analyzed 14h later. (a) t-SNE plots. NK (CD3−NKp46+), B (CD19+), CD3+CD4+ T, CD3+CD8+ T, plasmacytoid dendritic (pDC) (CD11c+B220+SiglecH+), classical dendritic (DC) (CD11c+SiglecH−B220−), neutrophil (CD11b+Ly6G+Ly6C−CCR2−), iMo (CD11b+Ly6ChighCCR2+Ly6G−), other CD11b+ (CD11b+Ly6G−Ly6Clow) cells. (b) Cell number. iMo (PBS n=9, pIC n=12); NK (PBS n=2, pIC n=3); neutrophil (PBS n=4, pIC n=6); other CD11b+ (PBS n=8, pIC n=10); pDC (PBS n=7, pIC n=8); DC (PBS n=7, pIC n=8). 5 experiments (with varying combinations of antibodies). (c,d) On d0 and d2, WT mice were injected with a depleting anti-Ly6C/G antibody or untreated. On d1, mice received CD69-KO lymphocytes. On d2, mice were treated s.c. with PBS or pIC, and dLN analyzed 14h later. (c) S1PR1 on CD69-KO CD4+ T cells. (d) 3 experiments. PBS (n=6), pIC (n=6), pIC anti-Ly6C/G (n=9). (e) Irradiated WT mice were reconstituted with a 1:1 mix of indicated BM, and analyzed 12–16 weeks later. On d0 and d2, chimeras were treated with DT. On d1, they received CD69-KO lymphocytes. On d2, they were injected s.c. with PBS or pIC, and dLN analyzed 14h later. 5 experiments. LitCtl:LitCtl (PBS n=5, pIC n=6); CCR2DTR:LitCtl (PBS n=6, pIC n=6); LitCtl:SPHK-KO (PBS n=5, pIC n=4); CCR2DTR:SPHK-KO (PBS n=6, pIC n=12). (f) WT mice received CD69-KO lymphocytes. 1d later, mice received an intra-LN injection of the indicated Ly6ChiCD11b+ iMo sorted from LN of pIC-treated mixed BM chimeras (WT:CD69-KO or WT:SPHK-KO). Alternately, mice were injected intra-LN with PBS (sham), injected s.c. with pIC, or untreated. 14h later injected LN were analyzed. 3 experiments. Untreated (n=6); sham (n=6); pIC (n=10); iMo WT (n=6); iMo SPHK-KO (n=9); iMo CD69-KO (n=7). (g) CD69-KO S1P-sensor+ T cells were cultured for 8h across a transwell from Ly6ChiCD11b+ iMo sorted from LN of pIC-treated mixed BM chimeras (WT:CD69-KO or WT:SPHK-KO). Sensor+ cells were analyzed by confocal microscopy. Quantification of S1P reporting, as in Fig. 1g. Each point represents the ratio of surface GFP:RFP on one cell. 3 experiments. Media n=20; iMo WT n=64; iMo SPHK-KO n=41; iMo CD69-KO n=65. (h) Transwell migration assay. Percent of input migrated to the bottom well. 6 experiments. Empty vector (media n=6, WT n=7, WT/αS1P n=2, SPHK-KO n=6, SPHK-KO/αS1P n=3, CD69-KO n=7, CD69-KO/αS1P n=2); S1PR1 (media n=5, WT n=6, WT/αS1P n=6, SPHK-KO n=5, SPHK-KO/αS1P n=5, CD69-KO n=6, CD69-KO/αS1P n=6), S1PR5 (media n=6, WT n=7, WT/αS1P n=6, SPHK-KO n=5, SPHK-KO/αS1P n=5, CD69-KO n=7, CD69KO/αS1P n=6). (i,j) CD69-KO or littermate control mice were injected s.c. with pIC or PBS, and dLN analyzed 14h later. (i) Surface S1PR1 on CD4+ T cells. Controls gated on CD69low cells. (j) 5 experiments. LitCtl (PBS n=6, pIC n=7); CD69-KO (PBS n=11, pIC n=13). (k) As in (e), but with CD69-KO instead of SPHK-KO BM. 3 experiments. LitCtl:LitCtl (PBS n=4, pIC n=4); CCR2DTR:LitCtl (PBS n=6, pIC n=8); LitCtl:CD69-KO (PBS n=5, pIC n=5); CCR2DTR:CD69-KO (PBS n=6, pIC n=6). Mean values +/− SEM. Mann-Whitney two-tailed t-test.
To target S1P production by iMo more specifically, we used mixed BM chimeras. We reconstituted WT mice with a 1:1 mix of SPHK-KO BM (unable to produce S1P) and BM that was SPHK-WT but expressed the diphtheria toxin (DT) receptor driven by the CCR2 promoter (CCR2-DTR). CCR2 is highly expressed by iMo(11). After DT treatment, iMo from the CCR2-DTR donor were eliminated and the only remaining iMo were SPHK-KO, while 50% of the CCR2-negative hematopoietic cells remained SPHK-WT. We also made a series of control chimeras. We challenged DT-treated chimeras with pIC. When CCR2+ cells could no longer make S1P, S1PR1 was no longer down-modulated on T cells in the dLN (Fig. 2e; E.D. Fig. 3i–m). These results were consistent with iMo as a source of LN S1P.
If iMo supplied LN S1P during an immune response, iMo transferred to an otherwise healthy mouse should raise LN S1P. We injected control or SPHK-KO iMo into LN of WT recipients at numbers comparable to those recruited upon pIC treatment. Control, but not SPHK-KO, iMo induced S1PR1 down-modulation on LN T cells (Fig. 2f; E.D. Fig. 4a–f).
Last, we assayed S1P release by iMo ex vivo. iMo secreted too little S1P for mass spectrometry measurement – T cells respond to as little as 100 pM S1P, while mass spectrometry detects ~100 nM. As one alternative, we cultured iMo across a transwell from Cd69−/− polyclonal T cells expressing the S1P sensor. Control iMo secreted S1P, measured by the ratio of surface S1PR1-GFP: S1PR1NB-RFP on the sensor-expressing T cells, while SPHK-KO iMo did not (Fig. 2g; E.D. Fig. 4g–k). We also tested whether supernatant from iMo could induce S1P-dependent chemotaxis. We transduced a B cell line with vector, S1PR1, or S1PR5. We plated the cells across a transwell from iMo. Vector-transduced cells did not migrate to iMo. S1PR1- and S1PR5-transduced cells migrated to WT but not SPHK-KO iMo, and their migration was blocked by a blocking antibody to S1P (Fig. 2h).
iMo require CD69 to supply LN S1P.
We next asked what factors regulate S1P secretion by iMo. CD69 is expressed rapidly and robustly after activation by virtually all leukocytes, but CD69’s function has remained unclear. Many phenotypes of Cd69−/− mice may not be explained by CD69’s well-established interaction with S1PR1(12,13). To avoid potentially confounding factors in the experiments above, we adoptively transferred Cd69−/− T cells to WT hosts. Surprisingly, when we instead induced inflammation with pIC in fully Cd69−/− mice, we did not observe S1PR1 down-modulation on T cells (Fig. 2i–j; E.D. Fig. 5a–h). This suggested that CD69 might be required for iMo to supply S1P.
To test whether iMo need CD69 to supply S1P to T cells, we used mixed BM chimera, similar to those described above. We lethally irradiated WT mice and reconstituted them with a 1:1 mix of Cd69−/− BM and CCR2-DTR BM. When CCR2+ cells no longer expressed CD69, S1PR1 was no longer down-modulated on T cells in the dLN (Fig. 2k; E.D. Fig. 5i–n). We also injected control and Cd69−/− iMo into LN of WT recipients, and found that control but not Cd69−/− iMo induced S1PR1 down-modulation on LN T cells (Fig 2f; E.D. Fig. 4a–f). Last, we could not detect S1P secretion by Cd69−/− iMo ex vivo (Fig. 2g–h; E.D. Fig. 4g–i). These results were consistent with a requirement for CD69 expression by iMo to supply LN S1P.
We next addressed how CD69 enabled iMo to supply S1P to T cells. We performed RNA-Seq on Cd69−/− and WT iMo sorted from LN of mixed BM chimeras, so that they were taken from the same environment. Many genes were differentially expressed, and one intriguing change was in S1pr5 (S1P receptor 5), which was suppressed when iMo expressed Cd69 (E.D. Fig. 6a,k). We confirmed this change by RT-qPCR (Fig. 3a). We bred Cd69−/−S1pr5−/− mice, and found that loss of S1PR5 partially rescued T cell exposure to S1P (Fig. 3b–c). To address the mechanism, we asked whether CD69 promoted iMo accumulation in the LN, potentially in part by blocking S1PR5-guided egress(1). However, we found no difference in the number of Cd69−/− compared to control iMo (Fig. 3d, E.D. Fig. 6b–c). A second possibility was that CD69 might promote iMo positioning in the T cell zone, potentially in part by repressing S1PR5, which is known to hold NK cells in the LN periphery(7). We found that Cd69−/− iMo poorly infiltrated the T zone, and their positioning was restored by loss of S1pr5 (Fig. 3e, E.D. Fig. 6d–e). A third, not mutually exclusive, possibility was that CD69 promoted iMo S1P release. Part of the mechanism might be that S1PR5 on iMo “caught” S1P secreted by the iMo and prevented the S1P from reaching nearby T cells. Indeed, Cd69−/− iMo S1P secretion was partially restored upon loss of S1pr5 (Fig. 3f, E.D. Fig. 6f). A cell line transduced with S1pr5 cleared S1P from culture medium more efficiently than controls, and Cd69−/− iMo cleared S1P from culture medium more efficiently than Cd69−/−S1pr5−/− iMo (E.D. Fig. 6g–j).
Fig. 3: CD69 promotes iMo S1P secretion in part by repressing S1pr5 expression.
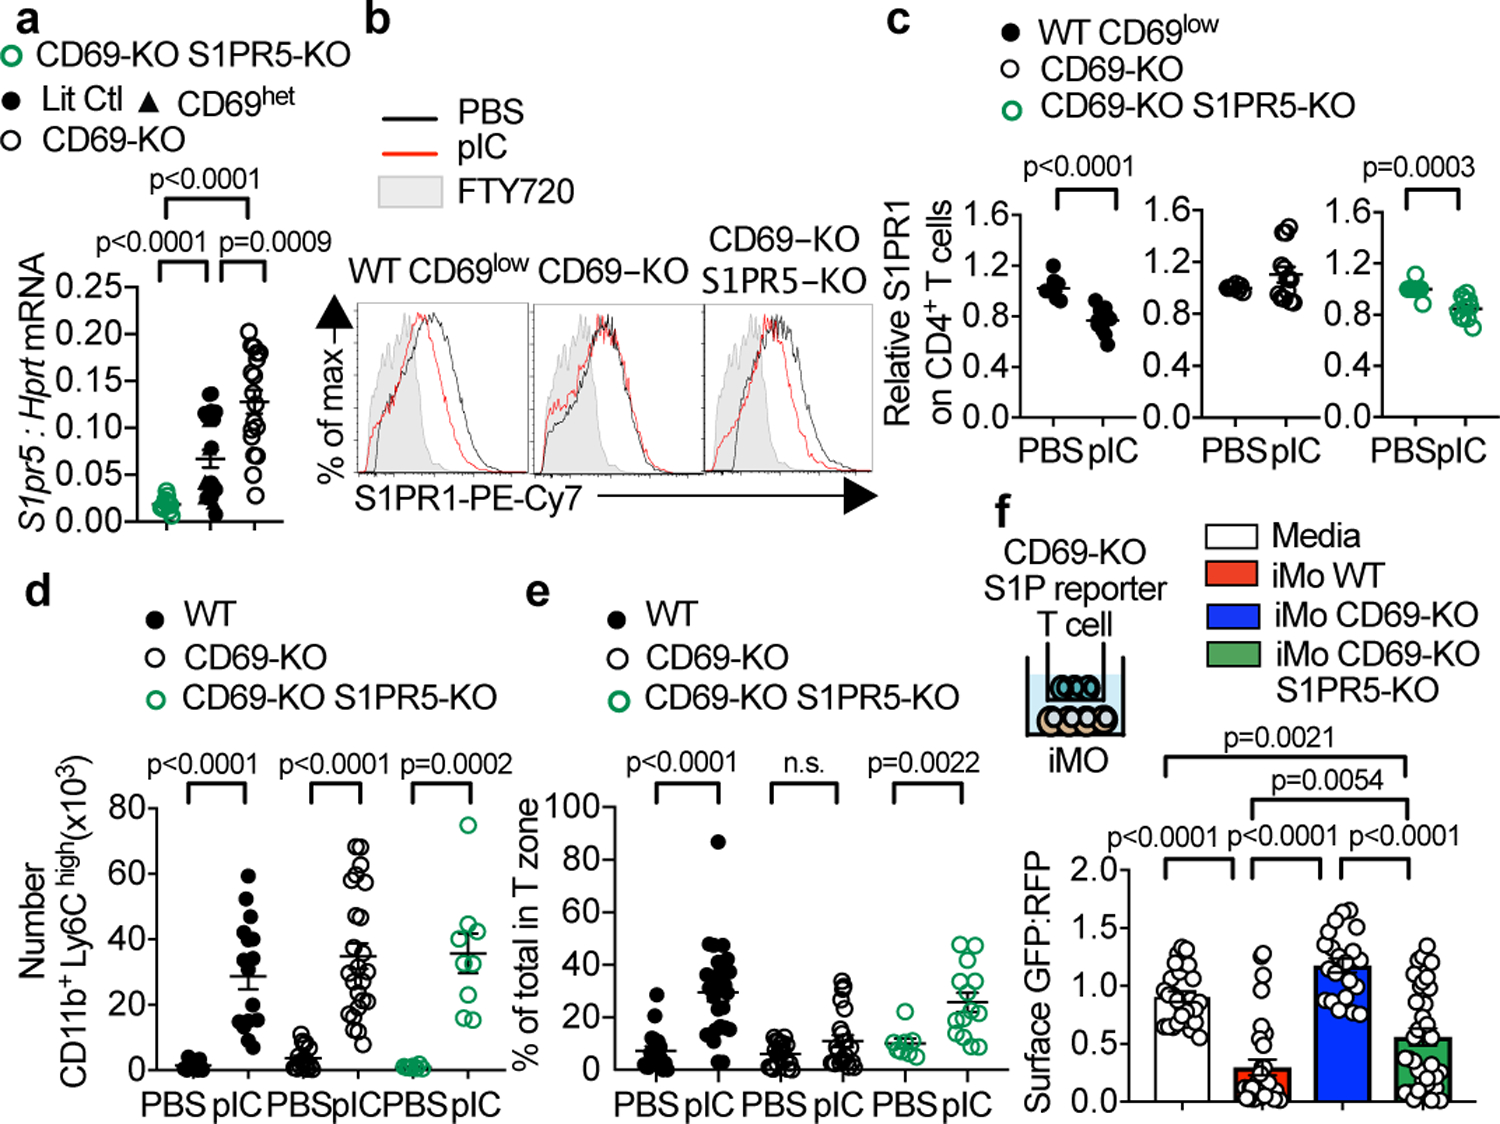
(a)S1pr5 transcripts, measured by RT-qPCR, in iMo sorted from BM chimeras [Cd69+/+ (Ctl) with CD69-KO littermates (1:1 mixed BM chimeras), CD69-HET with CD69-KO littermates (1:1 mixed BM chimeras), CD69-KO with CD69-KO S1PR5-KO (1:1 mixed BM chimeras), Cd69+/+S1pr5+/+ (Ctl) with CD69-KO S1PR5-KO littermates (1:1 mixed BM chimeras), CD69-HET, and CD69-KO; cells were congenically marked with CD45.1 and CD45.2, and markers switched among genotypes between experiments]. 9 experiments. CD69-KO S1PR5-KO n=12; Ctl n=15; CD69-HET n=6; CD69-KO n=17. (b-e) Littermate control (or WT), CD69-KO, and CD69-KO S1PR5-KO mice were injected s.c. with PBS or pIC. 14h later, dLN were analyzed. (b) S1PR1 on endogenous CD4+ CD69low (WT) or CD69-KO (CD69-KO, CD69-KO S1PR5-KO) T cells. (c) 5 experiments. WT CD69low (PBS n=9, pIC n=12); CD69-KO (PBS n=8, pIC n=13); CD69-KO S1PR5-KO (PBS n=8, pIC n=11). (d) iMo in dLN. 9 experiments. WT (PBS n=14, pIC n=17); CD69-KO (PBS n=17, pIC n=24); CD69-KO S1PR5-KO (PBS n=6, pIC n=9). (e) Percent of iMo in T zone. Each point represents one LN section, analyzed by confocal microscopy. 4 experiments. Number of mice: WT (PBS n=6, pIC n=7); CD69-KO (PBS n=6, pIC n=8); CD69-KO S1PR5-KO (PBS n=3, pIC n=5). Number of areas: WT (PBS n= 18, pIC n=26); CD69-KO (PBS n=19, pIC n=22); CD69-KO S1PR5-KO (PBS n=7, pIC n=14). (f) CD69-KO S1P-sensor+ T cells were cultured for 12h across a transwell from media or Ly6ChiCD11b+ iMo sorted from LN of pIC-treated mixed BM chimeras (WT with CD69-KO, or WT with CD69-KO S1PR5-KO). Sensor+ cells analyzed by confocal microscopy. Quantification as in Fig. 2g. 3 experiments. Media n=26; iMo WT n=30; iMo CD69-KO n=21; iMo CD69-KO S1PR5-KO n=34. Mean values +/− SEM. Mann-Whitney two-tailed t-test.
iMo S1P regulates the course of EAE.
Drugs targeting S1P signaling are widely used to treat multiple sclerosis (MS). We therefore assessed S1P gradients in experimental autoimmune encephalomyelitis (EAE), a mouse model of MS. We found reduced surface S1PR1 on T cells in the draining cervical LN at the onset of EAE symptoms, consistent with increased S1P (Fig. 4a–b; E.D. Fig. 7, 8a). iMo purified from the dLN of mice with EAE secreted S1P ex vivo, and in mixed BM chimeras, S1PR1 down-modulation was lost when CCR2+ cells could not make S1P or did not express CD69 (Fig. 4c,k; E.D. Fig. 8b–c, 9a–f). At the same timepoint, we observed a substantial reduction in total and MOG/Ab-specific T helper 17 (Th17) and T follicular helper (Tfh) cells in the dLN, and a reduction of Th17 cells in the central nervous system (CNS) (few Tfh were in the CNS) (Fig. 4f–j, n–o; E.D. Fig. 9g–h, 10a–g). The course of disease was delayed, despite being unusually aggressive as the mice were BM chimeras repeatedly treated with DT (Fig. 4d–e, l–m; E.D. Fig. 10a).
Fig. 4: IMo supply S1P in the dLN in EAE.
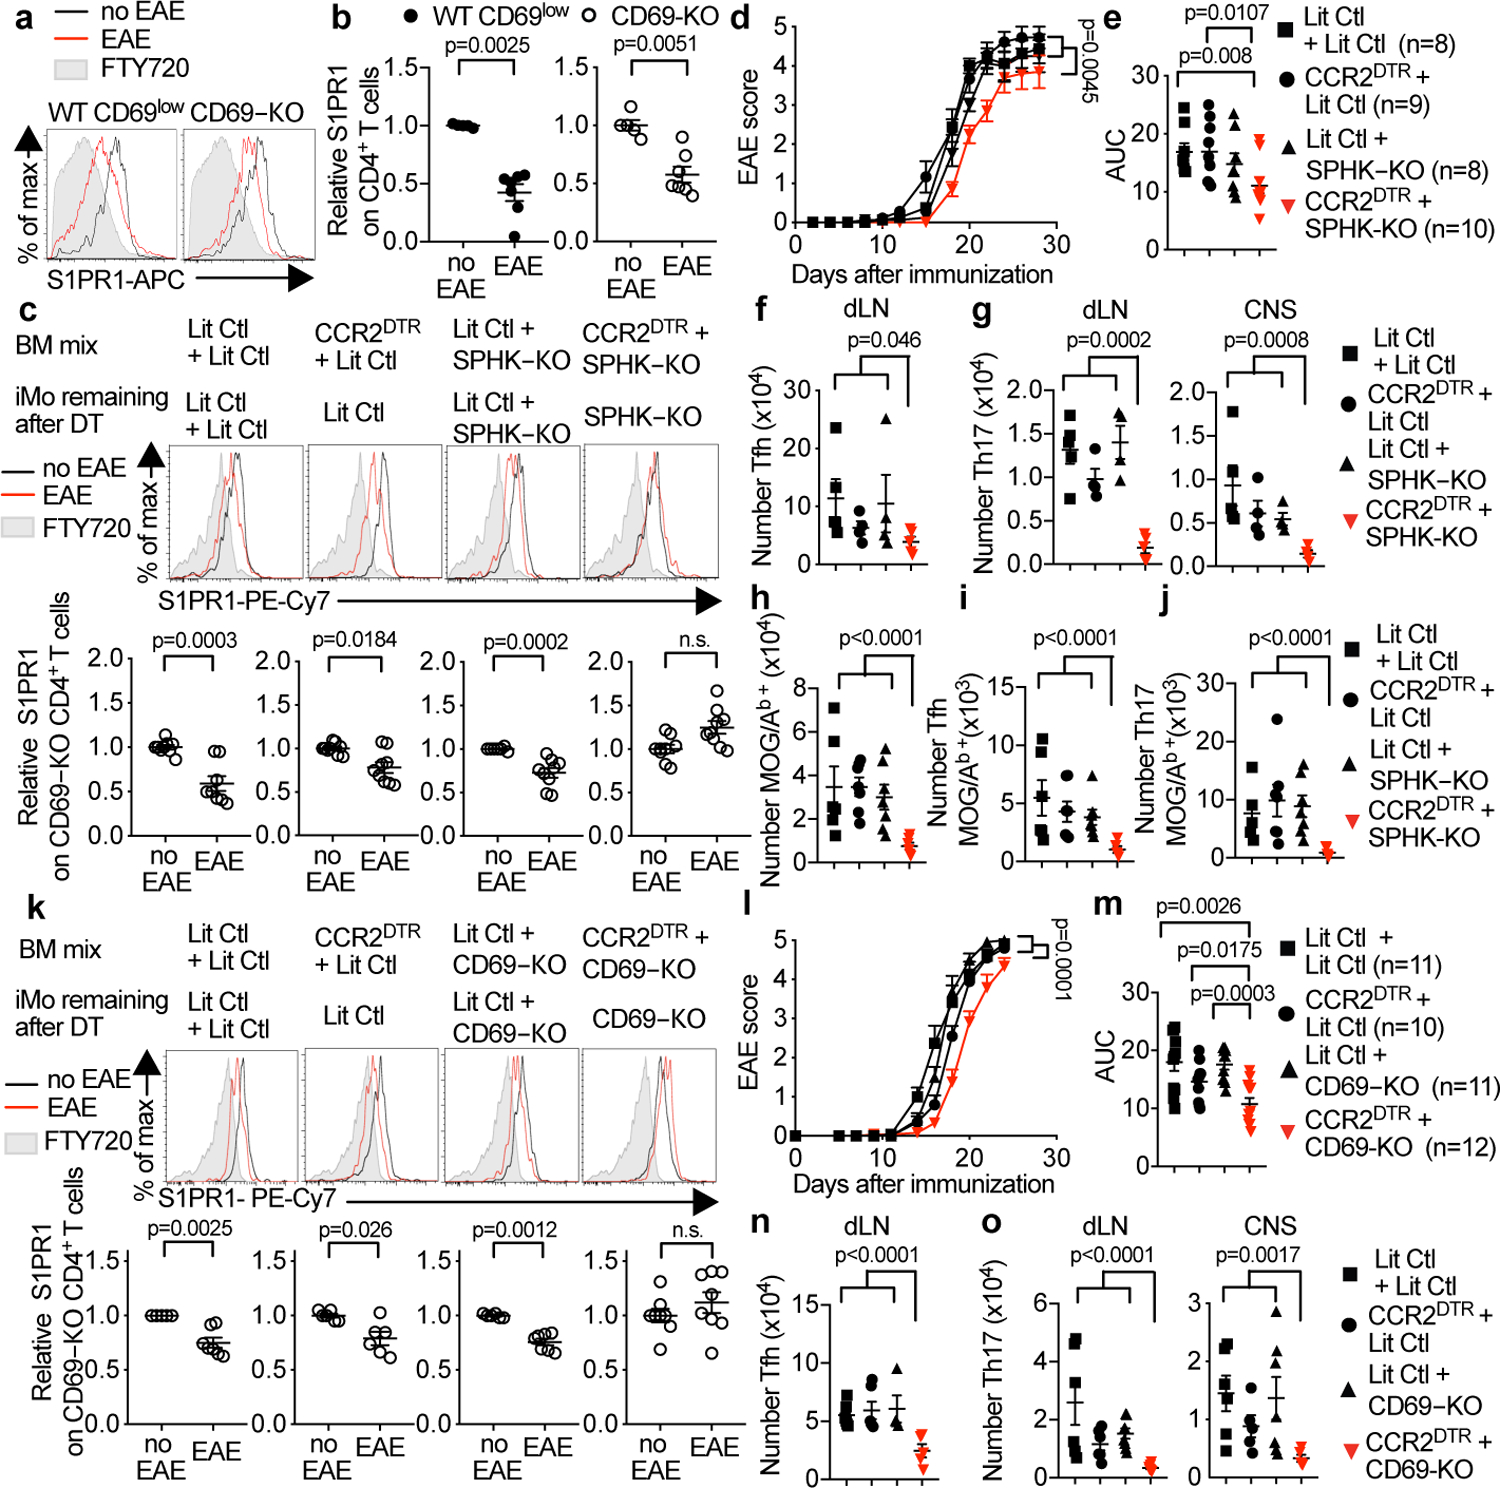
(a,b) C57BL/6 mice received CD69-KO lymphocytes. 1d later, EAE (n=7) was induced or controls were treated with PBS (n=5). 12d-14d later, cervical LN were analyzed. (a) S1PR1 on endogenous (WT) CD69low CD4+ T cells (left) and CD69-KO CD4+ T cells (right). (b) 3 experiments. (c) Indicated chimeras (as in Fig. 2e) received CD69-KO lymphocytes on d0. On d0 and every 3 days thereafter, they were injected with DT. On d1 EAE was induced (or mice treated with PBS). 10d-12d later, S1PR1 on CD69-KO CD4+ T cells in dLN was analyzed. 6 experiments. LitCtl:LitCtl (PBS n=9, EAE n=8); CCR2DTR:LitCtl (PBS n=9, EAE n=9); LitCtl:SPHK-KO (PBS n=7, EAE n=9); CCR2DTR:SPHK-KO (PBS n=9, EAE n=9). (d-j) EAE was induced in indicated chimeras. Mice were treated 1 day before EAE induction and every 3 days thereafter with DT. (d) Disease score and (e) area under disease curve (AUC). 3 experiments. (f,g) T cells 10–12d after EAE induction. 3 experiments. LitCtl:LitCtl (n=5); CCR2DTR:LitCtl (n=4); LitCtl:SPHK-KO (n=4); CCR2DTR:SPHK-KO (n=5). (f) Tfh (CD4+PD1hiCXCR5hi) in dLN. (g) Th17 (CD4+Rorγt+Foxp3−) in dLN, CNS. (h-j) MOG/Ab-tetramer+ CD4+ T cells in dLN 9d after EAE induction. 2 experiments. LitCtl:LitCtl (n=6); CCR2DTR:LitCtl (n=7); LitCtl:SPHK-KO (n=7); CCR2DTR:SPHK-KO (n=6). (h) Total, (i) Tfh, (j) Th17. (k-o) As for (c-g), but with indicated chimeras testing the role of CD69, and transferred CD69-KO cells were CFSE-labeled. (k) 3 experiments. LitCtl:LitCtl (PBS n=5, EAE n=7); CCR2DTR:LitCtl (PBS n=6, EAE n=6); LitCtl:CD69-KO (PBS n=6, EAE n=7); CCR2DTR:SPHK-KO (PBS n=8, EAE n=8). (l-m) 3 experiments. (n-o) 4 experiments. (n) LitCtl:LitCtl (n=6); CCR2DTR:LitCtl (n=6); LitCtl:CD69-KO (n=4); CCR2DTR:SPHK-KO (n=5). (o) LitCtl: LitCtl (n=6); CCR2DTR:LitCtl (n=6 dLN, n=5 CNS); LitCtl:CD69-KO (n=8 dLN, n=7 CNS); CCR2DTR:SPHK-KO (n=7). Mean values +/− SEM. Mann-Whitney two-tailed t-test. For EAE curve, two-way ANOVA, Geisser-Greenhouse correction.
Overall, our data indicate that LN S1P levels rise during an immune response. We used Cd69−/− T cells as probes to avoid confounding effects of cell-intrinsic CD69-mediated S1PR1 internalization, an interaction confirmed here (E.D. Fig. 3m, E.D. Fig. 5l, E.D. Fig. 9b,f). However, most T cells express high levels of CD69 transiently, leaving a wide window during which altered LN S1P could affect disease. This may be early in an immune response; even after pIC injection, ~40% of CD4 T cells in the dLN remain CD69lo (E.D. Fig. 1j). This may also be later in the immune response. At the onset of EAE symptoms, few lymphocytes express surface CD69, including MOG/Ab-specific T cells (E.D. Fig. 7a–b). The role of iMo in supplying LN S1P was unexpected, and T cell retention may synergize with iMo roles in antigen presentation and cytokine production(10,14,15). Lipopolysaccharide induces S1PR1 activation in the liver, which requires hematopoietic S1P; we hypothesize that this is due to iMo infiltration(16). Our data also indicate that the early activation marker CD69 retains cells in an inflamed environment by regulating both S1P gradients and receptors. Finally, this study raises the question of how iMo-derived S1P regulates Tfh and Th17 numbers. There are many possibilities, but several lines of evidence favor the possibility that LN residence time regulates differentiation, and future work will address this (E.D. Fig. 10)(17,18). Manipulating LN residence time with the many drugs targeting S1P signaling may be advantageous in some settings. On the other hand, one devastating side-effect of MS treatment with Gilenya, which targets four of the five S1P receptors, is severe disease rebound after drug withdrawal; we speculate that this may be due to T cells’ extended retention in the LN inducing stronger activation(19). Future studies will test how changing S1P levels and immune responses are intertwined throughout the body.
Methods:
Mice:
C57BL/6J (WT, CD45.2), B6.SJL-PtprcaPepcb/BoyJ (CD45.1), CD69-KO(20), UBC-GFP(21), Sphk1f/f(22), Sphk2−/−(23), Mx1-Cre+(24), S1pr5−/−(25), CCR2-DTR(11), Sphk1−/− (26), CCR2-RFP (27), and S1P sensor(8) mice have been previously described. All mice were on a C57BL/6 background. 8 mice from the Cd69−/− and Cd69−/−S1pr5−/− colonies were tested for 120 SNPs (Transnetyx C57BL/6 x129 panel v.2), and all animals tested were at least 97.5% C57BL/6. Mice were 5–42 weeks old at the time of analysis. Male and female mice were used depending on availability, as sex did not seem to affect the results. The only exception was the experiments tracking EAE clinical score over time, which were performed with females. (Analysis of S1PR1 and T cell subtypes in EAE was done with both sexes, and sex did not seem to affect the results.) Mice were compared to littermate controls or to WT C57BL/6 mice as indicated. Mice were housed in specific pathogen-free conditions in New York University School of Medicine animal facilities. All cages were on a 12:12-h light:dark cycle (lights on, 0700) in a temperature- and humidity-controlled room. Room temperature was maintained at 72 ± 2 °F (22.2 ± 1.1 °C), and room humidity was maintained at 30% to 70%.
Sample sizes balanced statistical robustness and animal welfare, and negative results should not be over-interpreted. No animals were excluded from analysis unless they were clearly sick (hunched, low body weight). These criteria were pre-established, and are standard in the laboratory. No specific method of randomization was used to allocate mice into groups, although sex-matched littermates were used when possible. The order of sample collection and data acquisition was designed to avoid experimental bias: collection and processing of samples from control and knockout, as well as treated and untreated animals, were alternated. EAE scoring was blinded. Quantitative image analysis was automated (ImageJ macro), with the only user input being the definition of regions. Other experiments were not strictly blinded because the measurements were quantitative, without the subjectivity of disease scoring or qualitative image analysis.
All animal experiments were performed in accordance with protocols approved by the New York University Institutional Animal Care and Use Committee.
For pIC treatment, mice were injected subcutaneously (s.c.) in the footpad or flank with 10µg poly (I:C) (GE Healthcare).
For FTY720 treatment, mice were injected intraperitoneally (i.p.) with 2mg/kg FTY720 (Cayman Chemical) 12h before analysis.
For 4-deoxypyridoxine treatment, mice received 30 mg/L 4-deoxypyridoxine (Sigma) and 1 g/L sucrose or 1 g/L sucrose alone in the drinking water from day 4 after EAE induction until analysis.
To generate bone marrow chimeras, recipients were lethally irradiated by two doses of 6.6 Gray separated by at least 4 hours, followed by intravenous (i.v.) transfer of 2 × 10⁶ bone marrow cells (or two times 2× 10⁶ bone marrow cells for mixed chimeras). Experiments were performed at least 12 weeks after bone marrow transplantation.
To generate bone marrow chimeras over-expressing S1PR1, bone marrow donors were treated i.p. with 150mg/kg 5-fluorouracil (Sigma). 7 days later these mice were euthanized, and their bone marrow was transduced with retrovirus encoding murine S1PR1-IRES-GFP or IRES-GFP as previously described in (9, 25) [retroviral backbone: MSCV2.2; packaging cell line: HEK-293T (ATCC CRL-11268)]. The transduction was done immediately ex vivo, and repeated 6 hours later. 2.5 × 10⁶ cells were injected i.v. to recipients lethally irradiated by two doses of 6.6 Gray. Experiments were performed at least 20 weeks after bone marrow transplantation. The efficiency of transduction was on average 0.8% of total CD45+ in the S1PR1-IRES-GFP group and 13% of total CD45+ in the IRES-GFP group. HEK-293T cells were not authenticated or tested for mycoplasma.
To induce Mx1-Cre, 3- to 5-day-old mice received a single i.p. injection of 50–70 μL pIC (GE Healthcare) at a concentration of 2 mg/mL in PBS. All mice in each litter (SPHK-KO mice and controls) were treated identically.
For integrin blockade, mice were injected i.v. with 100 μg monoclonal antibody to integrin α4 (clone PS/2; BioXCell) and 100 μg monoclonal antibody to integrin αL (clone M17/4; BioXCell).
To deplete Ly6C/G+cells, mice were injected i.p. with 500µg anti-Ly6C/G (clone RB6–8C5; BioXCell) 2 days before and on the day of pIC treatment (28, 29).
To deplete CCR2+cells, mice were treated with diphtheria toxin (Sigma), reconstituted at 1 mg/ml in PBS and frozen at −80°C. Mice received 10 ng/g diphtheria toxin i.p. in 0.2–0.3 ml PBS. For pIC injection experiments, mice were treated 2 days before and on the day of pIC treatment. For EAE experiments, mice were treated on the day of MOG immunization and every 3 days after.
To induce EAE, mice were immunized with 450 μg MOG 35–55 peptide in PBS emulsified 1:1 in incomplete Freund’s adjuvant (BD Biosciences) supplemented with a final concentration of 5 mg/mL of Mycobacterium tuberculosis (H37Ra; BD Biosciences). 100µL volume was injected s.c. in each of 3 locations. Pertussis toxin (200 ng in 100 μL PBS; List Biological Laboratories) was injected i.p. on the day of immunization (day −1) and 2 days later (day 1). Animals were scored for clinical symptoms as follows: 0, no signs of disease; 1, decreased tail tone or flaccid tail; 2, weakness in the limbs and loss of righting reflex; 3, inability to move one or both hind limbs, urinary incontinence; 4, weakness of both forelimbs and hindlimbs, complete hind-limb paralysis, atonic bladder; 5, moribund.
Confocal microscopy of tissue sections:
Mice were lethally anesthetized and perfused with 1% PFA in PBS. Organs were fixed in 4% PFA in PBS for 1 h at room temperature (22–25 °C) with gentle shaking; dehydrated overnight in 30% sucrose in PBS at 16 °C with gentle shaking; embedded in OCT (Sakura); and snap-frozen in dry-ice-cold 2-methylbutane. Sections 8–14 μm in thickness were cut, fixed with ice-cold acetone for 10 min, and air-dried. All staining was performed at room temperature (22–25 °C) in a humidified chamber.
For S1PR1 sensor staining, sections were permeabilized for 10 min with 0.5% Triton X-100 in PBS; washed in PBS; and blocked by incubation for 10–30 min with 0.1% Triton X-100, 5% normal goat serum, and 5% normal donkey serum. They were then washed with PBS; incubated for 1 h in blocking buffer with polyclonal chicken anti-GFP (Abcam, ab13970) final concentration 28 µg/ml, and polyclonal rabbit anti-Tag-RFP (Evrogen, AB234) final concentration 40 µg/ml; washed; incubated with polyclonal Alexa Fluor 488–conjugated goat anti-chicken (Jackson Immunoresearch, 103–545-155) final concentration 0.75 µg/ml, and polyclonal Alexa Fluor 647–conjugated donkey anti-rabbit (Jackson Immunoresearch, 711–605-152) final concentration 6 µg/ml; washed; and incubated with anti-Lyve1-AlexaFluor488 (eBioscience, ALY7) final concentration 1.25 µg/ml, and anti-CD4-PE (Biolegend, RM4–5) final concentration 1 µg/ml, or anti-CD4-eFluor450 (Invitrogen, RM4–5) final concentration 1.25 µg/ml. In some cases, sections were stained instead with anti-Lyve1-biotin (eBioscience, ALY7) final concentration 1.25 µg/ml; these sections were blocked with Vector Laboratories’ Avidin/Biotin blocking kit, and stained with streptavidin-BV421.
For inflammatory monocyte localization, sections were blocked for 10–30 min in PBS with 4% normal rat serum, 4% normal mouse serum, 10 μg/ml anti-CD16/32 (BioLegend, clone 93), and 0.1% Triton X-100; washed in PBS; and stained in blocking buffer for 1 h with monoclonal rat anti-Ly6C (Biolegend, HK1.4) final concentration 2.5 µg/ml, then with PE-conjugated polyclonal goat anti-rat IgG (Biolegend, Poly 4054) final concentration 1 µg/ml, and finally with monoclonal anti-CD11b-APC (Biolegend, M1/70) final concentration 1 µg/ml, anti-Lyve1-AlexaFluor488 (eBioscience, ALY7) final concentration 1.25 µg/ml, and anti-CD4-eFluor450 (Invitrogen, RM4–5) final concentration 1 µg/ml. In some cases, sections were stained instead with anti-Lyve1-biotin (eBioscience, ALY7) final concentration 1.25 µg/ml; these sections were blocked with Vector Laboratries’ Avidin/Biotin blocking kit, and stained with streptavidin-BV421 and anti-CD4 AlexaFluor488 (Biolegend, RM 4–5) final concentration 1.25 µg/ml.
Slides were mounted with G-Fluoromount (Southern Biotech). Slides were visualized using a Zeiss 710 inverted confocal microscope with a 25×, or 63× oil-immersion objective and ZEN 2010 software. Images were processed with ImageJ v1.49. For all direct comparisons, samples were stained and imaged the same day with the same settings. The ratio of surface GFP:RFP for S1P sensor mice was analyzed as previously described(7). The ImageJ macro to localize inflammatory monocytes is included as Supplementary Information.
Confocal microscopy of S1P sensor T cells:
Transwell-cultivated T cells were cytospun at 800g for 6 min though a cytology funnel onto a slide (Thermo Scientific Shandon Coated Cytoslide). Then cells were fixed in 4% PFA for 15 min at room temperature; fixed with ice-cold acetone for 2 min; air-dried; permeabilized for 5 min with 0.5% Triton X-100 in PBS; and stained and analyzed as above (without Lyve1).
Cell preparation for adoptive transfer, in vitro culture, and flow cytometry:
CD69-KO lymphocyte preparation for adoptive transfer:
Lymphocytes were isolated from LN (axillary, brachial, inguinal, cervical, paraaortic) and in some cases spleen by mechanical disruption and filtration through a 70-μm cell strainer. Red blood cells were lysed with ACK buffer. Cells were enumerated with a cell counter (Beckman Coulter Multisizer 3) set to detect nuclei between 3.5 and 7 μm. When necessary, the cells were stained with CFSE before injection. For CFSE staining, lymphocytes were resuspended in PBS at 20 x106 cells/mL and CFSE was added to a final concentration of 2µM. Cells were incubated for 10 min at room temperature, and the reaction was stopped by adding FBS to a final concentration of 20% and incubating for 2 min. Labeled cells were washed 3 times in PBS prior to counting. 12–16 x106 cells were injected i.v.
CD69-KO lymphocyte preparation for cell culture:
Cells were prepared as for adoptive transfer, but CD69 KO T lymphocytes were further purified by negative selection for CD4 and CD8 using anti-CD11b, anti-CD11c, anti-NKP46, and anti-CD19 biotinylated antibodies (Stem Cell Technologies or eBioscience, biotin negative selection kit, used according to the manufacturer’s instructions).
Inflammatory monocyte preparation for adoptive transfer or culture:
Mice were injected i.v. with 200 µg pIC or PBS. 14 hours later mice were euthanized. Organs were minced, and then digested with collagenase IV (1 mg/ml, Sigma) and DNase I (0.2 mg/ml, Roche) in HBSS for 20 min at 37°C with gentle rocking. Collagenase IV was inactivated by washing with 5 mM EDTA and 3% FBS in PBS. The cell suspension was filtered through a 100 µm strainer and negatively selected for CD11b+ cells using anti-CD4, anti-CD8, anti-CD19, and anti-Ter119 biotinylated antibodies (Stem Cell Technologies, biotin negative selection kit, used according to the manufacturer’s instructions). The CD11b+-enriched cells were then stained and sorted for CD11b+ Ly6Chigh cells by flow cytometry (Beckman Coulter MoFlo or BD Biosciences FACSAria). In some experiments, 0.2 x10⁶ iMo were concentrated in 10µL and 5µL was injected into the inguinal LN using a 32-gauge Hamilton syringe as described(30, 31). In other experiments, iMo were cultured in RPMI with 0.5% fatty acid-free BSA, 10 mM HEPES, 2 mM L-glutamine, penicillin streptomycin, 50 μM β-mercaptoethanol, 0.1 mM non-essential amino acids, and 1 mM sodium pyruvate at 1 x 10⁶ per mL.
Cell preparation for flow cytometry: lymphoid organs
Lymphocytes were isolated from LN (axillary, brachial, inguinal, cervical, paraaortic) and in some cases spleen by mechanical disruption and filtration through a 70-μm cell strainer. Cells were enumerated with a cell counter (Beckman Coulter Multisizer 3) set to detect nuclei between 3.5 and 7 μm.
Cell preparation for flow cytometry: CNS
After euthanasia, mice were perfused with PBS. Spinal cord and brain were minced, and then digested for 30 min at 37 °C with gentle rocking with collagenase IV (1 mg/ml, Sigma) and DNase I (0.2 mg/ml, Roche) in HBSS. Collagenase IV was inactivated by washing with 5 mM EDTA and 3% FBS in PBS, and the cells were filtered through 70µm cell strainer. Further purification of lymphocytes was performed by density gradient centrifugation using 40% Percoll (GE Healthcare).
In vitro cell culture:
Cell line generation and culture:
WEHI-231 cells (a gift from Jason Cyster, ATCC CRL-1702) were transduced with retrovirus encoding murine S1PR1-IRES-GFP, S1PR5-IRES-GFP, or IRES-GFP alone [retroviral backbone: MSCV2.2; packaging cell line: HEK-293T (ATCC CRL-11268)]. The retroviral constructs have been previously described(9, 25). GFP+ cells were sorted and maintained in complete RPMI1640 (with 10% fetal bovine serum, penicillin/streptomycin, 10 mM HEPES, 2 mM L-glutamine, 50 μM β-mercaptoethanol, 1 mM sodium pyruvate, 0.1 mM non-essential amino acids). Cells were maintained between 0.1x 10⁶ and 1x 10 6 cells/mL. The cell lines were not authenticated. WEHI-231 cells were contaminated with mycoplasma, HEK-293T cells were not tested for mycoplasma.
Transwell migration:
0.5 x10⁵ WEHI-231 cells expressing the indicated constructs were tested for transmigration across 96-well uncoated 5 μm transwell filters (Corning Costar) to 0.2x10⁶ sorted iMo resuspended in 148µL with or without 10µg/mL anti-S1P antibody clone LT1002 (Echelon Bioscience). After 3 hours, migrated cells were enumerated by flow cytometry. Assay was performed in RPMI1640 supplemented with 0.5% fatty acid-free BSA (Calbiochem) penicillin/streptomycin, 10 mM HEPES, 2mM L-glutamine, 50 μM β-mercaptoethanol, 1 mM sodium pyruvate, 0.1mM non-essential amino acids.
S1PR1 downregulation:
0.1 x 10⁶ purified CD69-KO S1P sensor T cells (or CD69-KO T cells, E.D. Fig. 4j–k) were cultured across a 96-well 0.4 μm transwell filter (Corning Costar) from 0.2x10⁶ sorted iMo in 150µL. Cells were incubated for 8h (or 12h for E.D. Fig. 4j–k) in RPMI1640 supplemented with 0.5 % fatty acid BSA, penicillin/streptomycin, 10 mM HEPES, 2 mM L-glutamine, 50 μm β-mercaptoethanol, 1 mM sodium pyruvate, and 0.1mM non-essential amino acids.
S1P clearance:
0.2x10⁶ sorted iMo or 0.5 x10⁵ WEHI-231 cells were incubated for 5 hours with 50 nM S1P (Sigma) in 150µL RPMI1640 supplemented with 0.5% fatty acid-free BSA (Calbiochem) penicillin/streptomycin, 10 mM HEPES, 2mM L-glutamine, 50 μM β-mercaptoethanol, 1 mM sodium pyruvate, 0.1mM non-essential amino acids. Then 0.1 x 10⁶ purified CD69-KO S1P sensor T cells were cultured for 2 hours across a 96-well 0.4 μm transwell filter (Corning Costar) from these cells.
Flow cytometry:
For intracellular staining, cells were fixed and permeabilized with eBioscience’s Foxp3 kit, according to the manufacturer’s instructions. Staining for S1PR1 was done on ice in PBS supplemented with 0.05% sodium azide, 1mM EDTA, 0.5% FBS. Cells were stained for 90 min with anti–mouse S1PR1 (7.2 µg/mL; MAB7089; R&D Systems), washed twice in buffer; stained for 45 min with anti-rat IgG-biotin F(ab’)2 (9.5 µg/mL; Cat# 2340649; Jackson Immunoresearch); washed twice in buffer; and stained with streptavidin coupled with APC or PECy7 and the other surface membrane antibodies. To stain with the MOG/Ab (GWYRSPFSRVVH) and hCLIP/Ab (PVSKMRMATPLLMQA) tetramers, cells were incubated for 60 min at room temperature with 7.5 µg/mL tetramer (NIH Tetramer Core Facility). Additional antibodies are described in Supplementary Information Table 1. Cells were analyzed on a BD Biosciences LSRII flow cytometer running FACSDiva v. 8.02, and FlowJo software v. 9 or v.10 was used for data analysis (including t-SNE plots).
RNA-Seq:
Total RNA was extracted from sorted cell populations using TRIzol (Invitrogen) according to the manufacturer’s instructions. Phenol was removed using a Qiagen RNeasy MinElute Cleanup Kit, according to the manufacturer’s instructions. The quantity and quality of total RNA was assessed on a 2100 BioAnalyzer instrument (Agilent Technologies, Inc.). 1 ng of total RNA was used to prepare libraries using Trio RNA-Seq library prep kit (Tecan Genomics, Inc., part number 0506–96, mammalian rRNA Deplete) following the manufacturer’s instructions (https://www.nugen.com/sites/default/files/M01440v2_User_Guide%3A_Trio_RNA-Seq_4270.pdf). Briefly, the library prep consists of the following steps: DNase treatment to remove genomic DNA, first strand and second stand cDNA synthesis from the input RNA, single primer isothermal amplification (SPIA) of the resultant cDNAs, enzymatic fragmentation and construction of unique barcoded libraries, PCR library amplification (for these samples, 4 cycles were used) and a final step to remove rRNA transcripts. The Agencourt AMPure XP bead (Beckman Coulter) purified libraries were quantified using by qPCR and the size distribution was checked using Agilent TapeStation 2200. The libraries were subjected to paired-end 50 bp sequencing on HiSeq 2500 sequencing system (Illumina, v4 chemistry). RNAseq analysis: Sequencing reads were mapped to the mouse reference genome (GRCm38.85/mm10) using the STAR aligner (v2.5.0c)(32). Alignments were guided by a Gene Transfer Format file. The mean read insert sizes and their standard deviations were calculated using Picard tools (v.1.126) (http://broadinstitute.github.io/picard). The read count tables were generated using HTSeq (v0.6.0)(33), normalized based on their library size factors using DEseq2(34), and differential expression analysis was performed. The Read Per Million (RPM) normalized BigWig files were generated using BEDTools (v2.17.0)(35) and bedGraphToBigWig tool (v4). All downstream statistical analyses and generating plots were performed in R environment (v3.1.1) (http://www.r-project.org/).
RT-qPCR:
Total RNA was extracted from sorted cell populations using Trizol (Invitrogen) according to the manufacturer’s instructions. Before reverse transcription, RNA was treated with DNase I (Invitrogen). The RNA was converted to cDNA with Invitrogen’s Superscript III First Strand Synthesis System according to the manufacturer’s instructions, using a mix of oligo dT and random hexamers as primers. Quantitative PCR (qPCR) was performed on a Roche Light-Cycler 480 using iQ SYBR Green Supermix (Bio-Rad) according to the manufacturer’s instructions. Primer pairs used were: Hprt F 5′-AGGTTGCAAGCTTGCTGGT-3′, Hprt R 5′-TGAAGTACTCATTATAGTCAAGGGCA-3′; S1pr5 F 5′-GCCTGGTGCCTACTGCTACAG-3′, S1pr5 R 5′-CCTCCGTCGCTGGCTATTTCC-3′; Spns2 F 5′-AGAAGCCGCATCCTCAGTTAGC-3′, Spns2 R 5′-CAGGCCAGAATCTCCCCAAATC-3′; S1pr1 F 5′-GTGTAGACCCAGAGTCCTGCG-3′, S1pr1 R 5′-AGCTTTTCCTTGGCTGGAGAG-3′; Sphk1 F 5’-CTGGGCTGCGGCTCTATTCTGT-3’; Sphk1 R 5’-AAGGTGCCCACTGTGAAACGAA-3’; Sphk2 F 5’-GTTGTGATCTTGGAGGCTGGT-3’; Sphk2 R 5’-TAGGAACCAAACTCGCCGTG-3’.
To control for DNA contamination, a reaction without reverse transcriptase was performed in parallel for each sample/primer pair. To control for nonspecific amplification, the size of the reaction products was analyzed by agarose gel electrophoresis. Primer pairs were tested for linear amplification over two orders of magnitude.
Wright-Giemsa stain:
Freshly sorted CD11b+ Ly6C+ cells were cytospun onto a slide for 6 min at 800g (Thermo Scientific Shandon Coated Cytoslide). Slides were fixed for 1 min with ice-cold methanol and dried completely. Wright-Giemsa stain (Sigma) was performed for 30 sec, washed in PBS for 5 min, washed in water for 1 min twice, and dried overnight. A coverslip was affixed using Permount (Fisher, SP15–100). Purple shows nuclei, blue to light pink shows cytoplasm.
Statistical analysis:
Graphpad Prism v.8.0.1 and v.9.0.0 was used for Mann-Whitney two-tailed t test and two-way ANOVA with Geisser-Greenhouse correction.
Extended Data
E.D. Fig. 1: S1P increases in the dLN after pIC injection.
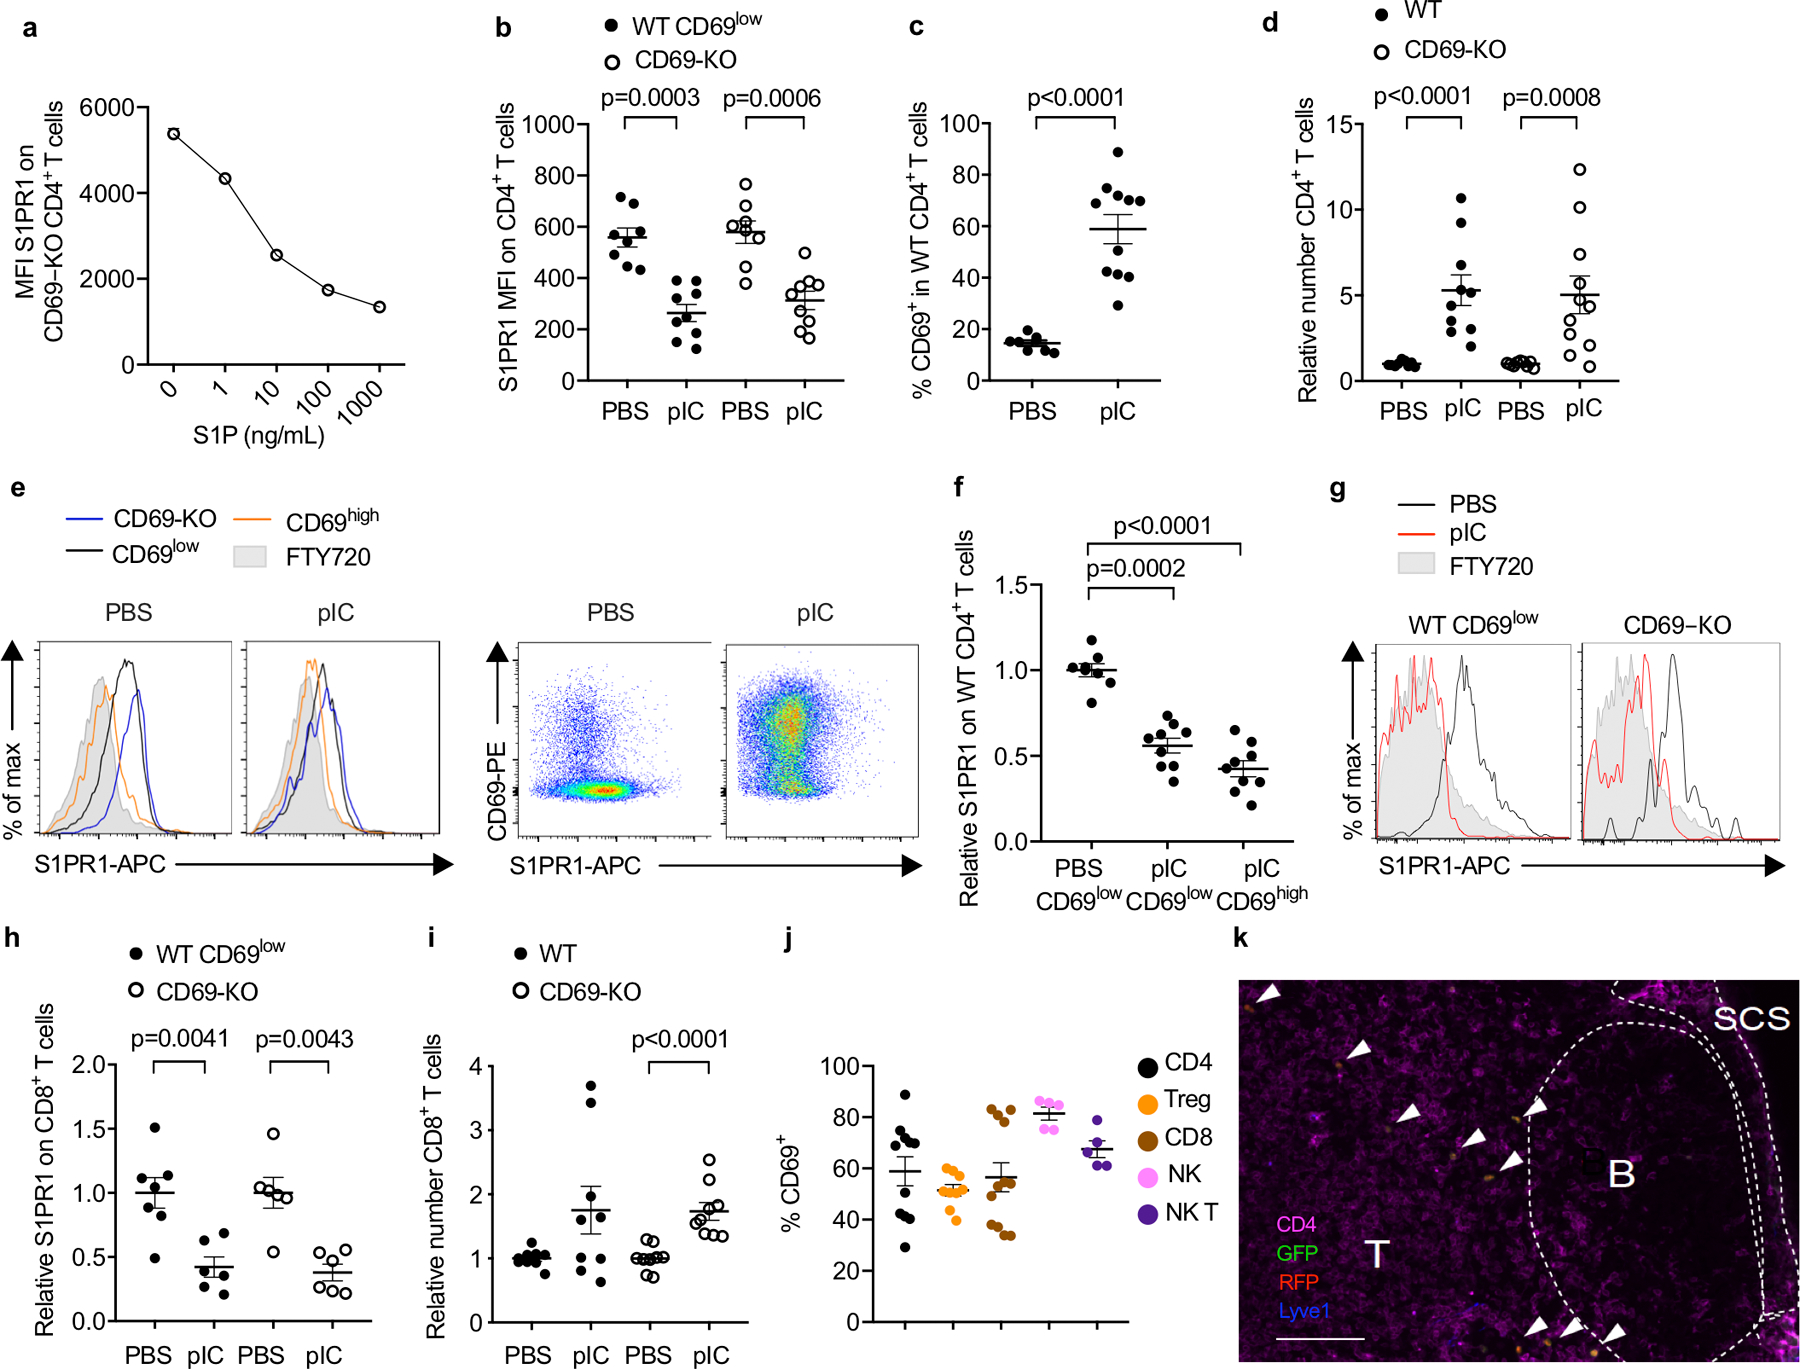
(a) CD69-KO lymphocytes (from LN) were incubated ex vivo with the indicated concentrations of S1P for 16h, and surface S1PR1 on CD4+ T cells was measured by flow cytometry. Average of triplicates +/− SEM in 1 experiment. (b-i) Experiment design and animals as in Fig. 1a–c. Compilation of 4 experiments for all panels except (h), which compiles 3 experiments. (b) Absolute MFI of S1PR1 for the cells shown in Fig. 1c. PBS (n=8); pIC (n=9). (c) Percent CD69+ among endogenous (WT) CD4+ T cells in dLN. PBS (n=8); pIC (n=11). (d) Relative number of the indicated CD4+ T cells in dLN. The number of endogenous CD4+ cells in the dLN of each mouse was divided by the mean number of endogenous CD4+ cells in the PBS-treated group; the number of transferred CD69-KO CD4+ cells in each mouse was similarly divided by the mean number of CD69-KO CD4+ transferred cells in the PBS-treated group. PBS (n=9); pIC (n=11). (e) (left) Representative histograms of S1PR1 on transferred CD69-KO, endogenous CD69low, and endogenous CD69high CD4 T cells in PBS- or pIC-treated mice. (right) Representative dot plots of CD69 vs S1PR1 on endogenous CD4 T cells in PBS- or pIC-treated mice. Representative of the data compiled in (f). (f) The S1PR1 MFI of endogenous CD69low or endogenous CD69high CD4+ cells in each mouse divided by the mean S1PR1 MFI of endogenous CD69low CD4+ cells in the PBS-treated group. PBS (n=8); pIC (n=9). (g) Representative histograms of surface S1PR1 on endogenous (WT) CD69low or transferred CD69-KO CD8+ T cells in the dLN. FTY720-treated mouse served as a negative control. (h) The S1PR1 MFI of the endogenous CD69low CD8+ cells in each mouse was divided by the mean S1PR1 MFI of the endogenous CD69low CD8+ cells in the PBS-treated group; the S1PR1 mean fluorescence intensity (MFI) of the transferred CD69-KO CD8+ cells in each mouse was similarly divided by the mean MFI of the transferred CD69-KO CD8+ cells in the PBS-treated group. PBS (n=7); pIC (n=6). (i) Relative number of the indicated CD8+ T cells in the dLN. PBS (n=9), pIC (n=9). (j) Experiment design as in Fig. 1a. Percent CD69+ among total CD4+ (n=11), Treg (CD4+ Foxp3+) (n=9), CD8+ (n=12), NK (NK1.1+CD3−) (n=5), and NKT (NK1.1+CD3+) (n=5) cells in the dLN of pIC-treated mice. Compilation of 4 experiments. (k) CD69-KO Sensor+ T cells were transferred i.v. into WT recipients. 24h later, mice were treated s.c. with PBS or pIC. 14h later, dLN were analyzed by confocal microscopy. Representative section, showing T zone, B follicles, and subcapsular sinus (SCS). Arrows indicate transferred cells. Scale bar, 100 µm. Representative of 5 experiments, PBS n=7, pIC n=8. Data are presented as mean values +/− SEM. Mann-Whitney two-tailed t test.
E.D. Fig. 2: S1P increases in the dLN of BM chimeras after pIC injection.
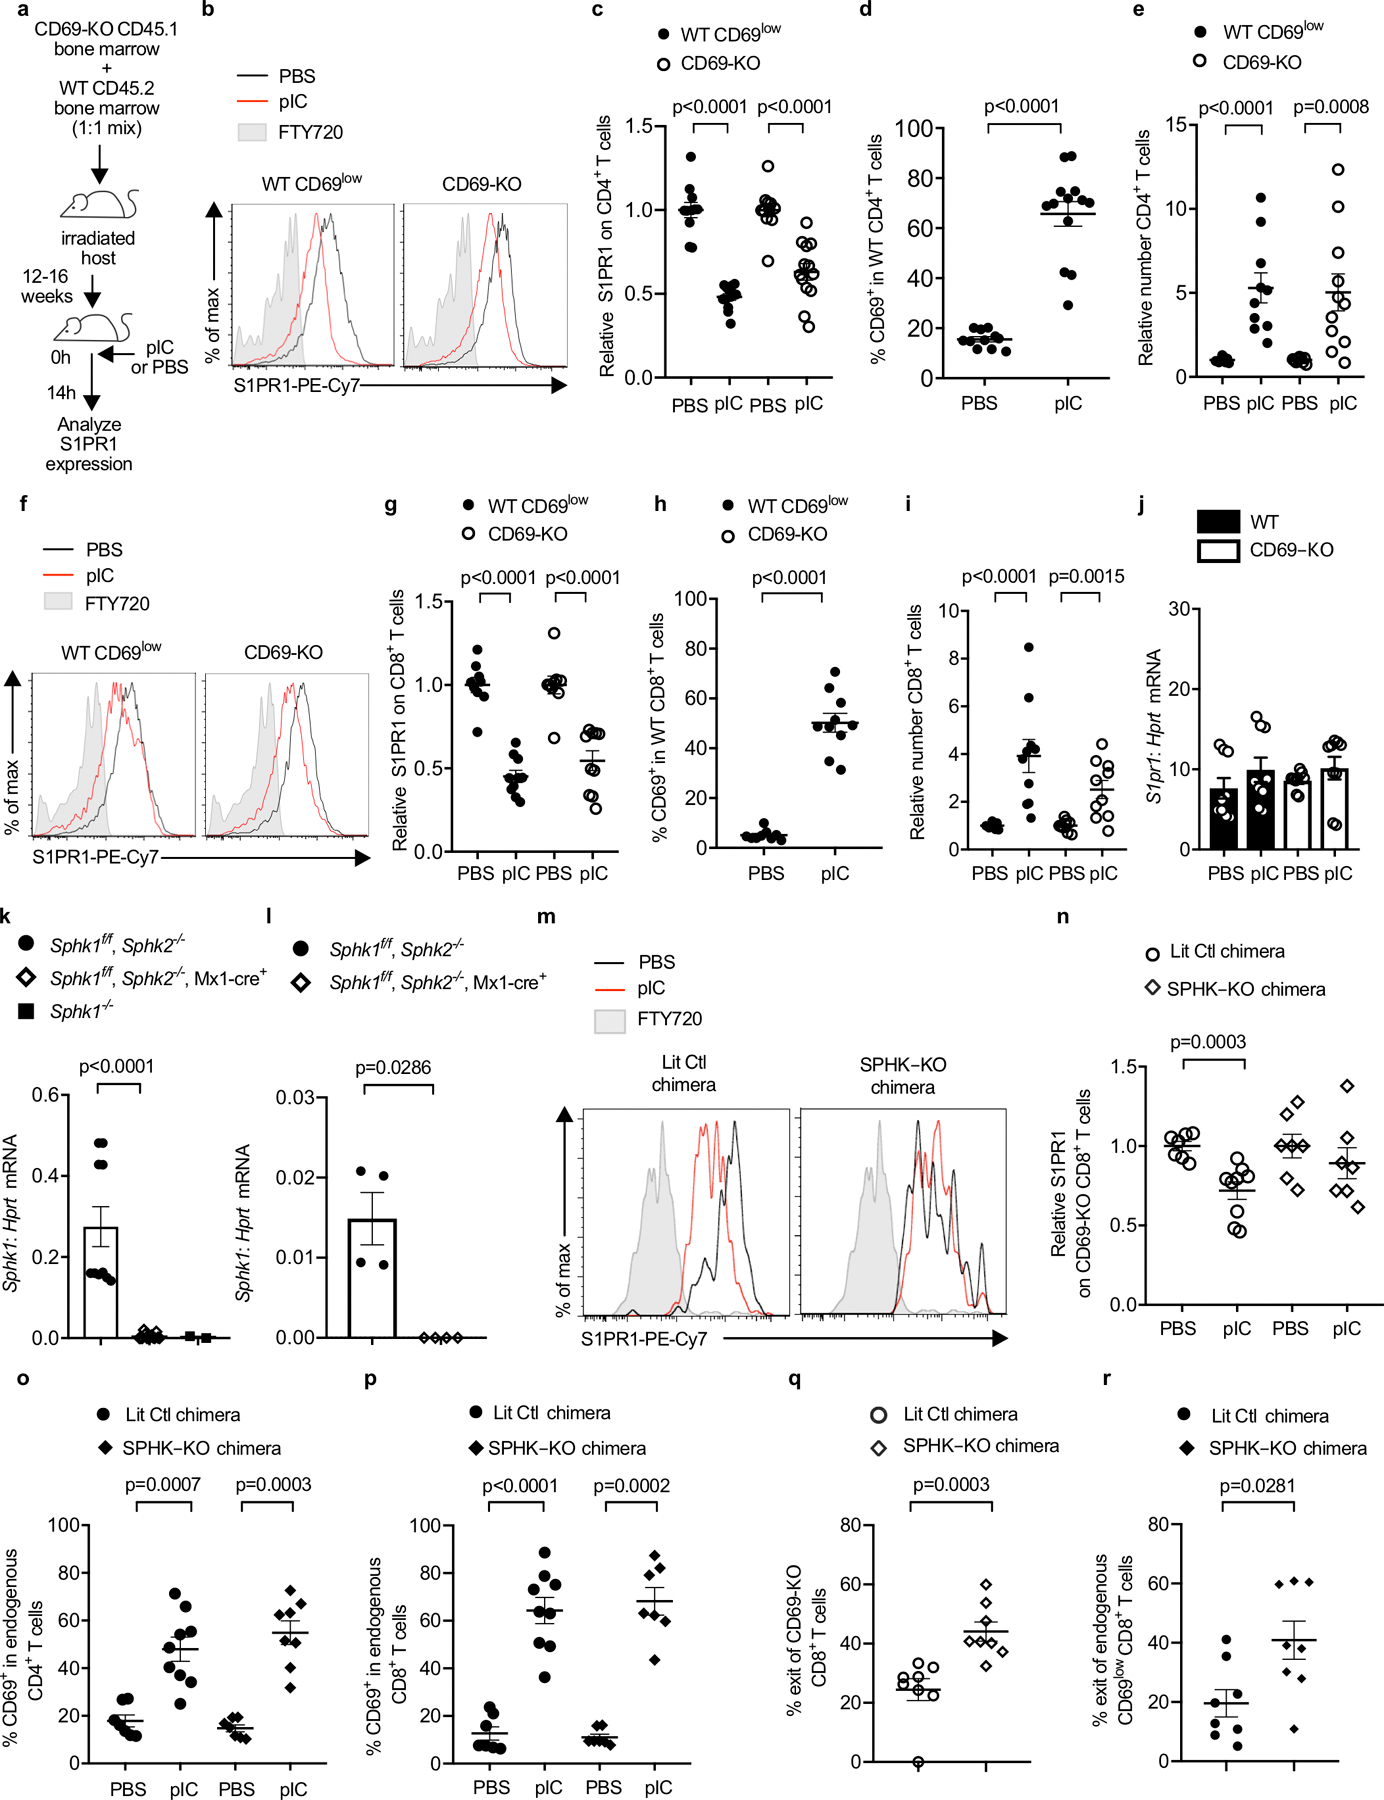
(a-j) C57BL/6 mice were lethally irradiated, reconstituted with a 1:1 mix of CD45.2+ WT and CD45.1+ CD69-KO BM, and allowed to recover for 12–16 weeks. The chimeras were injected s.c. with PBS or pIC, and dLN analyzed 14h later. Compilation of 3 (for CD8 analysis) - 4 (for CD4 analysis) experiments. (a) Experiment design. (b) S1PR1 on WT CD69low (left) and CD69-KO (right) CD4+ T cells. (c) Compilation. The S1PR1 MFI of the WT CD69low CD4+ T cells in each mouse was divided by the mean S1PR1 MFI of the WT CD69low CD4+ T cells in the PBS-treated group; the S1PR1 MFI of the CD69-KO CD4+ T cells in each mouse was similarly divided by the mean MFI of the CD69-KO CD4+ T cells in the PBS-treated group. Each point represents one mouse. PBS (n=11), pIC (n=13). (d) Percent CD69+ among WT CD4+ T cells. PBS (n=11), pIC (n=13). (e) Relative number of the indicated CD4+ T cells in the dLN. The number of CD4+ WT cells in the dLN of each mouse was divided by the mean number of CD4+ WT cells in the PBS-treated group; the number of CD69-KO CD4+ cells in each mouse was similarly divided by the mean number of CD69-KO CD4+ cells in the PBS-treated group. PBS (n=9), pIC (n=11). (f) S1PR1 expression on CD69low WT or CD69-KO CD8+ T cells. (g) Compilation, as in (c). PBS (n=9), pIC (n=10). (h) Percent CD69+ among WT CD8+ T cells. PBS (n=9), pIC (n=10). (i) Relative number of the indicated CD8+ T cells, as in (e). PBS (n=9), pIC (n=10). (j) RT-qPCR for S1pr1, normalized to Hprt. Compilation of 3 experiments. PBS (n=9), pIC (n=9). (k) RT-qPCR for Sphk1 in bone marrow of pIC-treated Sphk1f/fSphk2−/− (n=5 animals, bone marrow cells split into 2 samples prior to RNA purification), pIC-treated Sphk1f/fSphk2−/−Mx1-Cre+ (n=7 animals, bone marrow cells split into 2 samples prior to RNA purification), and Sphk1−/− (n=2 animals). Compilation of 2 experiments. (l) RT-qPCR for Sphk1 in blood of pIC-treated Sphk1f/fSphk2−/− (n=4) and pIC-treated Sphk1f/fSphk2−/−Mx1-Cre+(n=4) animals. One experiment. (m-r) UBC-GFP+ mice were lethally irradiated, reconstituted with pIC-treated Sphk1f/f Sphk2−/− Mx1-Cre+ CD45.2+ (SPHK-KO) or littermate control (LitCtl) BM, and left to recover for 12–14 weeks. Chimeras received CD45.1+ CD69-KO T cells i.v. 24h later, chimeras were injected s.c. with pIC or PBS. 14h later, dLN were analyzed. (m) S1PR1 on CD69-KO CD8+ T cells in LitCtl chimeras (left) or SPHK-KO chimeras (right). FT720-treated mouse served as a negative control. (n) Compilation of 3 experiments. The S1PR1 MFI on the CD69-KO CD8+ T cells in each mouse was divided by the mean S1PR1 MFI on the CD69-KO CD8+ T cells in the PBS-treated group. LitCtl (PBS n=7, pIC n=9); SPHK-KO (PBS n=7, pIC n=7). (o) Percent CD69+ among CD4+ T cells. Compilation of 3 experiments. LitCtl (PBS n=7, pIC n=9); SPHK-KO (PBS n=7, pIC n=8). (p) Percent CD69+ among CD8+ T cells. Compilation of 3 experiments. LitCtl (PBS n=7, pIC n=9); SPHK-KO (PBS n=7, pIC n=7). (q,r) CD69-KO CD45.1+ lymphocytes were transferred into LitCtl or SPHK-KO BM chimeras. 24h later, the chimeras were injected s.c. with pIC. 14h later, half of the mice in each group were euthanized and the cells in the dLN were counted. The remaining mice were injected i.v. with anti-αL and anti-α4 neutralizing antibodies. These antibodies blocked any further lymphocyte entry into the LN. 4h later, these mice were euthanized and the cells in the dLN were counted. The decline in cell numbers in the LN over 4 hours, with no further cell entry, indicated the exit rate. Compilation of 3 experiments. SPHK-KO (t=0 n=8; t=4h n=8), LitCtl (t=0 n=6, t=4h n=8). (q) Percent exit of CD69-KO CD8+ T cells. (r) Percent exit of endogenous CD69low CD8+ T cells. Each point represents one mouse at t=4h relative to the average at t=0. Data presented as mean values +/− SEM. Mann-Whitney two-tailed t test.
E.D. Fig. 3: CD11b+LY6ChiCCR2+ cells contribute to increased LN S1P.
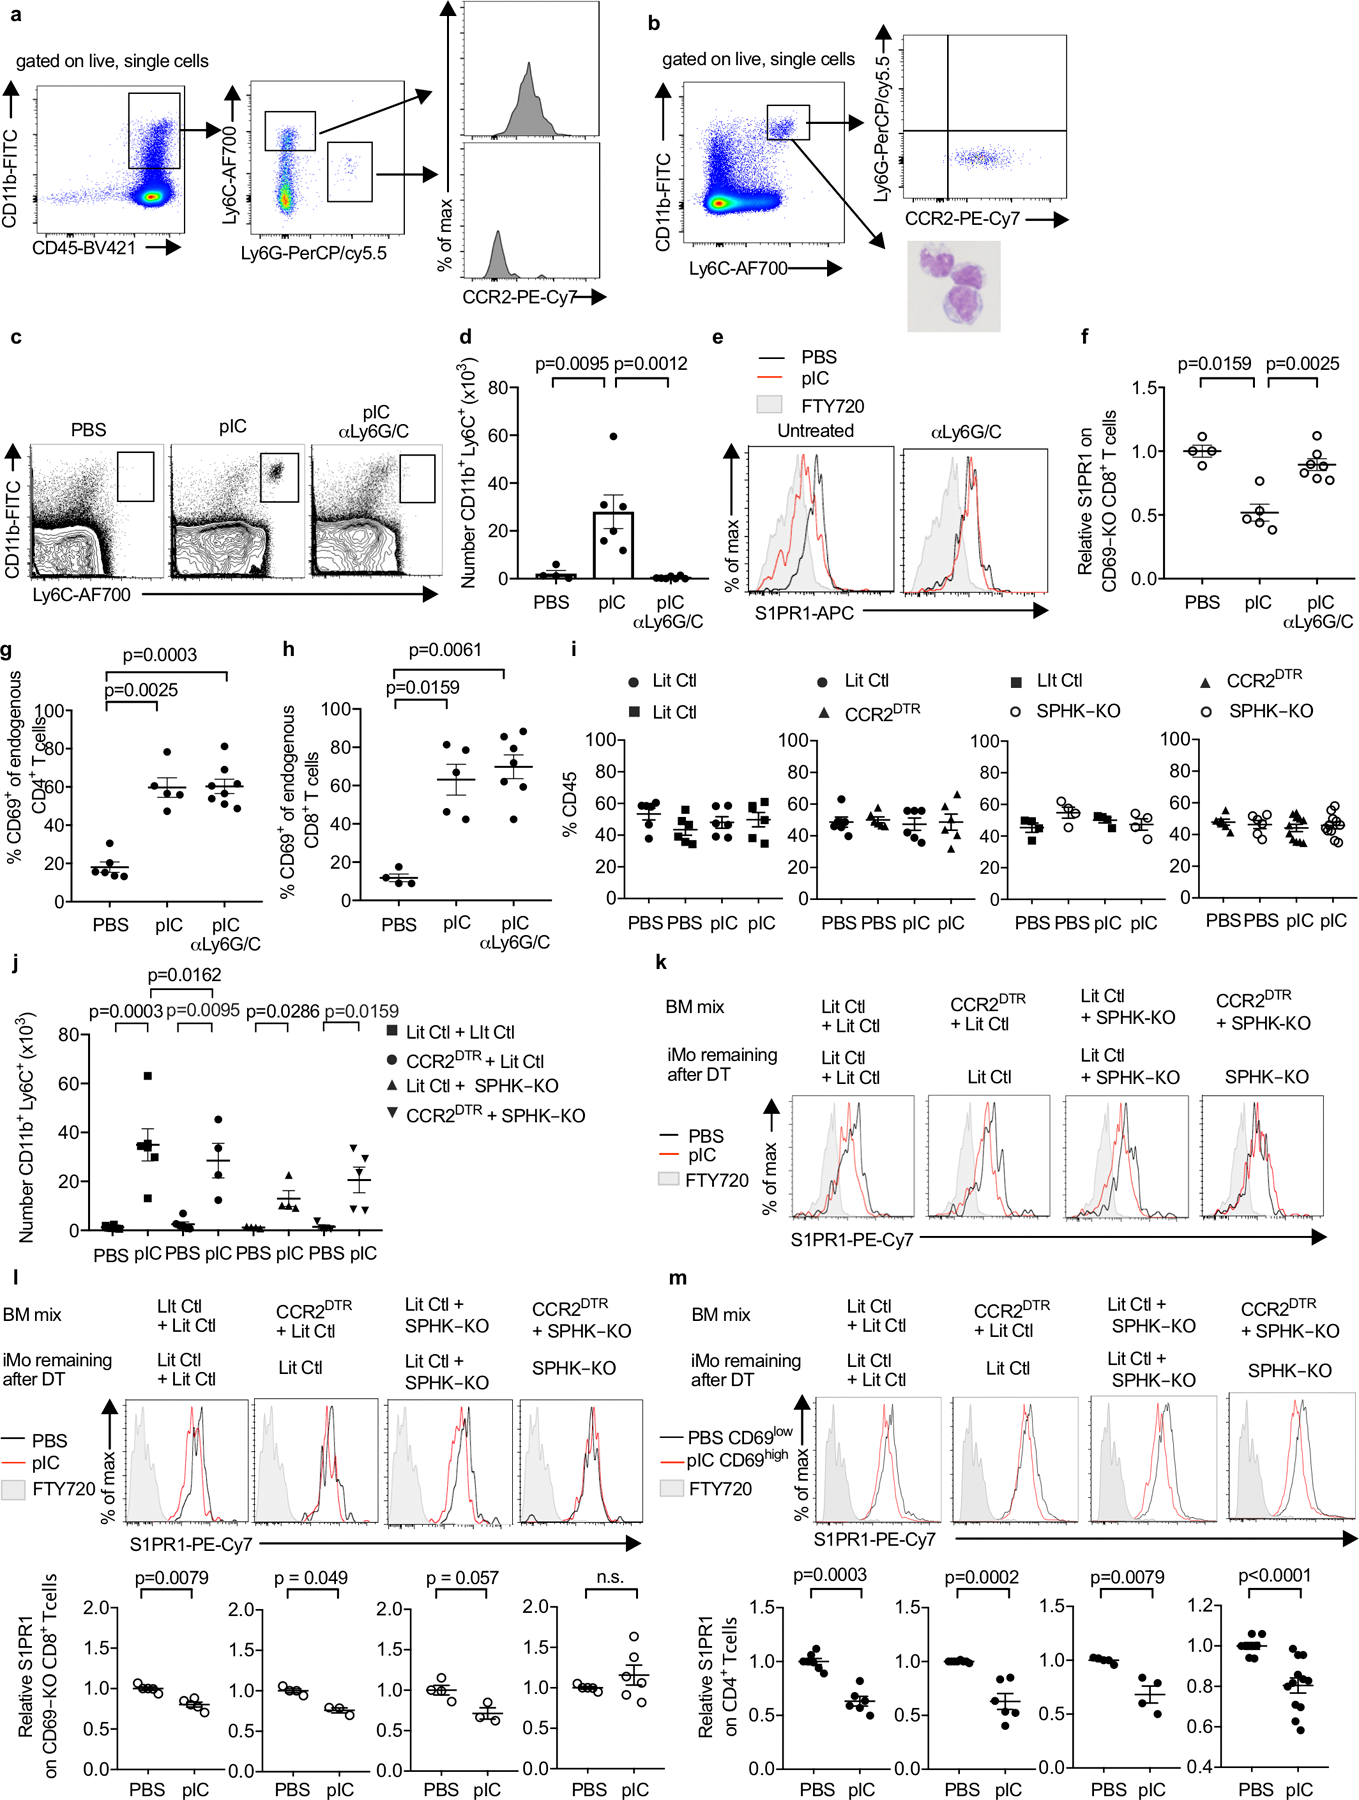
(a) Phenotype of cells infiltrating the dLN in WT mice 14h after pIC injection. Representative of 5 experiments. (b) Phenotype of sorted iMo. Left panel, sort gate (Ly6ChiCD11bhi). Right top panel, staining of sorted cells for Ly6G and CCR2. Representative of 3 experiments. Right bottom panel, Wright-Giemsa stain of sorted cells. Representative of 2 experiments. (c-h) C57BL/6 mice were injected i.p. with a depleting anti-Ly6C/G antibody on d0 and d2, or left untreated. On d1, the mice received CD69-KO CD45.1+ lymphocytes i.v. On d2, the mice were treated s.c. with PBS or pIC, and dLN were analyzed 14h later. Compilation of 3 experiments. (c) Representative flow cytometry plots. (d) Number of iMo in the dLN (PBS n=4, pIC n=6, pIC anti-Ly6C/G n=7). (e) S1PR1 on CD69-KO CD8+ T cells. (f) Compilation. (PBS n=4, pIC n=5, pIC anti-Ly6C/G n=7). (g) Percent CD4+ T cells that were CD69+ (PBS n=6, pIC n=5, pIC anti-Ly6C/G n=8). (h) Percent CD8+ T cells that were CD69+ (PBS n=4, pIC n=5, pIC anti-Ly6C/G n=7). (i-m) Lethally irradiated C57BL/6 mice were reconstituted with a 1:1 mix of the indicated BM, and analyzed 12–16 weeks later. On d0 and d2, the chimeras were treated with DT. On d1, the chimeras received CD69-KO CD45.1+ lymphocytes i.v. On d2, the chimeras were injected s.c. with PBS or pIC, and 14h later the dLN were analyzed. (i) Percent of total CD45+ cells contributed by each genotype in dLN of the indicated chimeras Compilation of 5 experiments. LitCtl:LitCtl (PBS n=6; pIC n=6); CCR2DTR:LitCtl (PBS n=6; pIC n=6); LitCtl:SPHK-KO (PBS n=4; pIC n=4); CCR2DTR:SPHK-KO (PBS n=6 pIC n=11). (j) Number of iMo in the dLN of the indicated chimeras. Compilation of 3 experiments. LitCtl:LitCtl (PBS n=6, pIC n=6); CCR2DTR:LitCtl (PBS n=6, pIC n=4); LitCtl:SPHK-KO (PBS n=4, pIC n=4); CCR2DTR:SPHK-KO (PBS n=6, pIC n=5). (k) Representative histograms of S1PR1 expression on CD69-KO CD4+ T cells in the indicated chimeras. (l) Representative histograms of S1PR1 expression on CD69-KO CD8+ T cells in the indicated chimeras (top) and compilation (bottom) of S1PR1 expression on CD69-KO CD8+ T cells in the indicated chimeras. Compilation of 3 experiments. LitCtl:LitCtl (PBS n=5, pIC n=5); CCR2DTR:LitCtl (PBS n=4, pIC n=3); LitCtl:SPHK-KO (PBS n=4, pIC n=3); CCR2DTR:SPHK-KO (PBS n=5, pIC n=6). (m) Representative histograms (top) and compilation (bottom) of S1PR1 expression on endogenous CD4 T cells in the indicated chimeras. For the compilation, the S1PR1 MFI of the CD69low CD4+ T cells in each mouse in the PBS-treated group was divided by the mean S1PR1 MFI of the CD69low CD4+ T cells in the PBS-treated group; the S1PR1 MFI of the CD69high CD4+ T cells in each mouse of the pIC-treated group was similarly divided by the mean MFI of the CD69low CD4+ T cells in the PBS-treated group. LitCtl:LitCtl (PBS n=7, pIC n=6); CCR2DTR:LitCtl (PBS n=6, pIC n=6); LitCtl:SPHK-KO (PBS n=4, pIC n=4); CCR2DTR:SPHK-KO (PBS n=8, pIC n=12). Compilation of 5 experiments. Bars represent mean +/− s.e.m. Mann-Whitney two-tailed t test.
E.D. Fig. 4: iMo are sufficient to supply LN S1P.
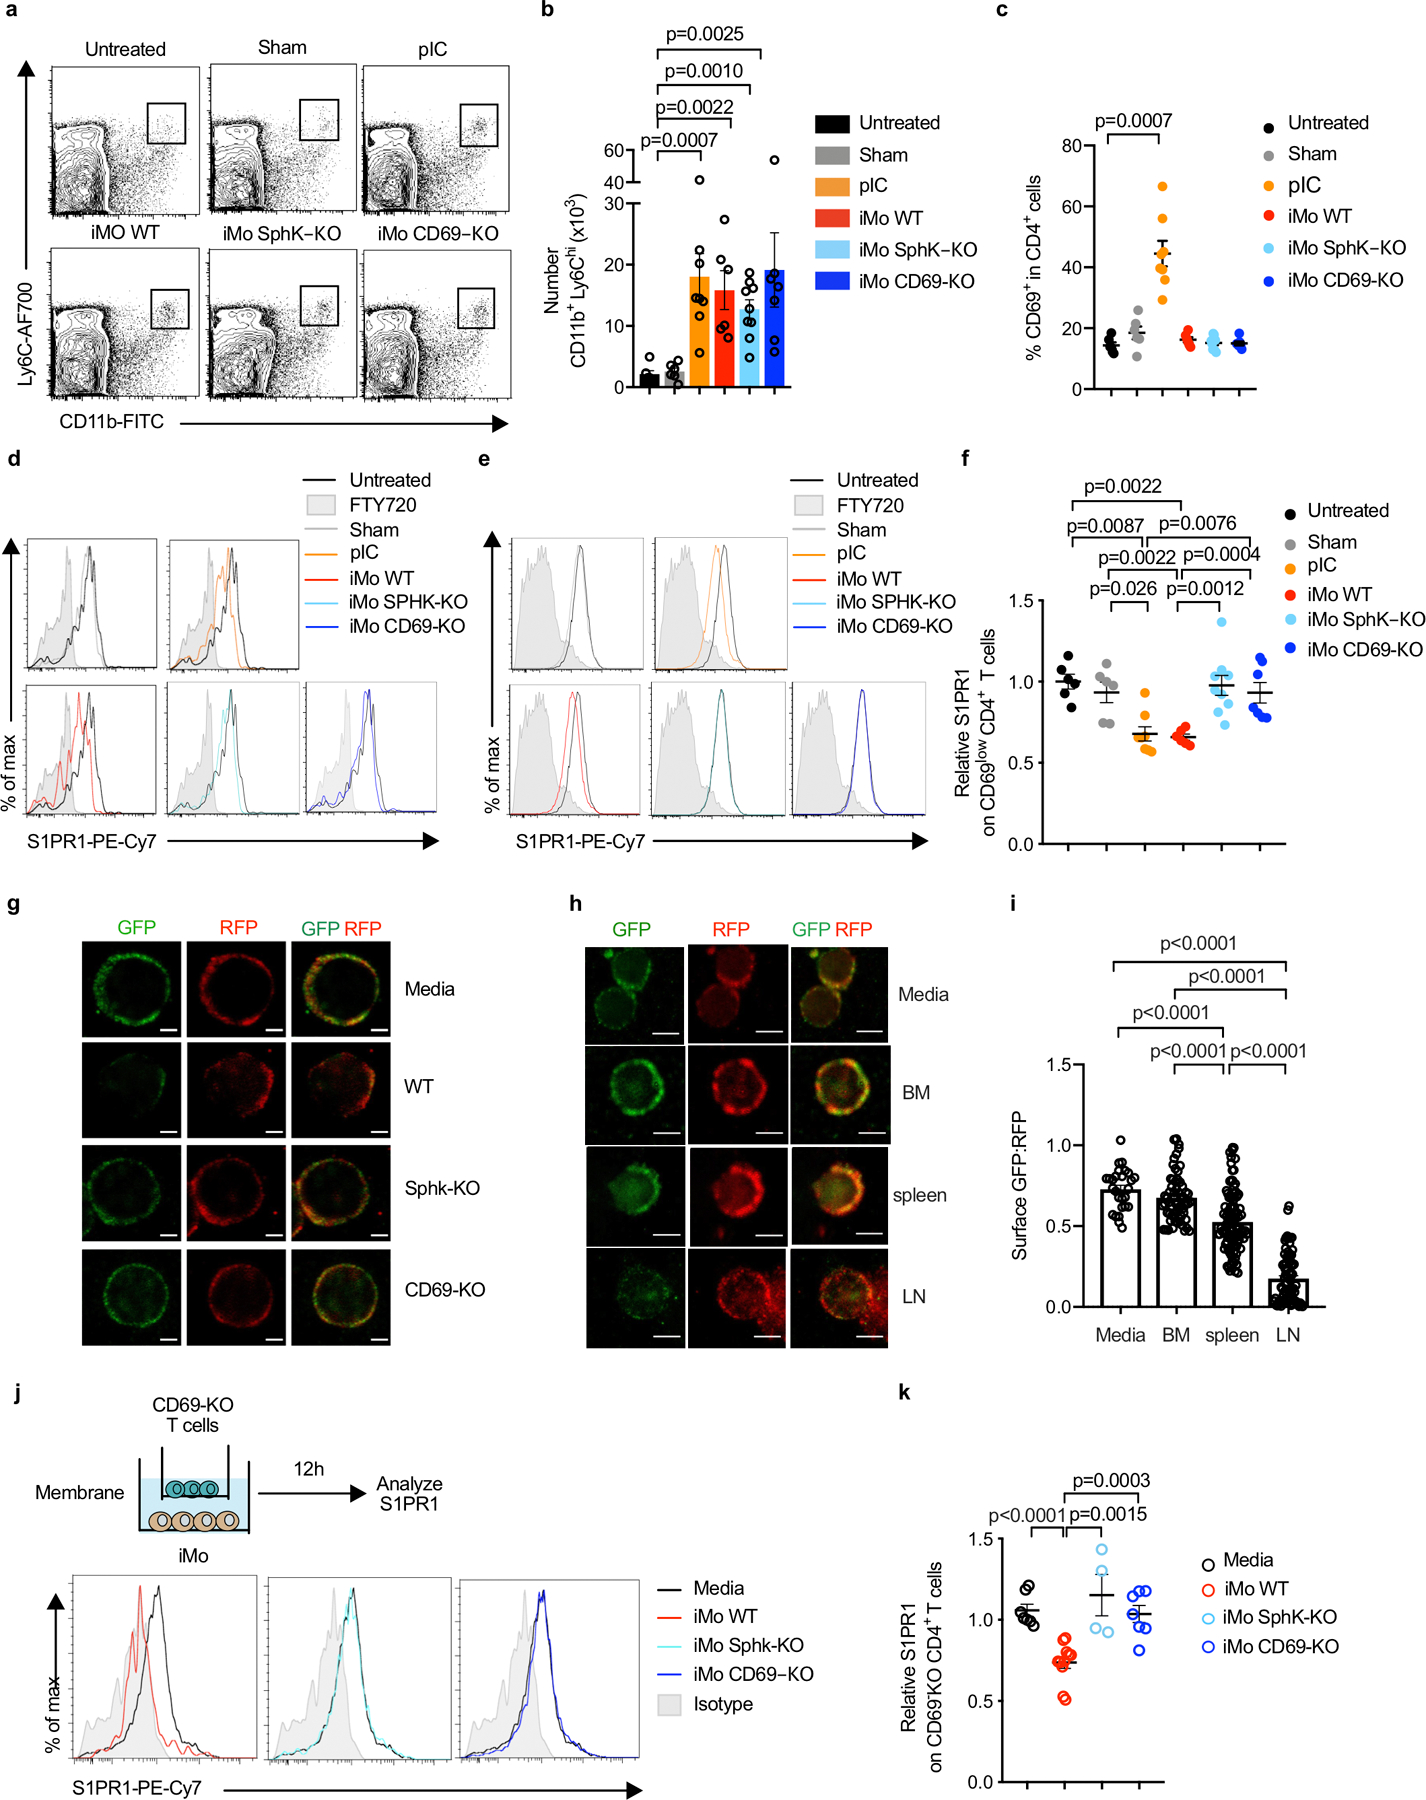
(a-f) C57BL/6 mice received CD69-KO CD45.1+ lymphocytes i.v. 1d later, the mice received an intra-LN injection of Ly6ChiCD11b+ iMo sorted from LN of mixed BM chimeras (WT+CD69-KO or WT+SPHK-KO). Alternately, mice were injected intra-LN with PBS (sham), injected s.c. with pIC, or left untreated. 14h later, the injected LN were analyzed. Compilation of 3 experiments, untreated (n=6); sham (n=6); pIC (n=8); iMo WT (n=6); iMo SPHK-KO (n=9); iMo CD69-KO (n=7). (a) Representative dot plots (gated on live single cells) showing CD11b+Ly6Chi iMo in the injected LN. (b) Number of iMo in the injected LN. (c) Percent CD69+ among CD4+ T cells in the injected LN. (d) S1PR1 on CD69-KO CD4+ T cells in the indicated mice. (e) S1PR1 on CD69low endogenous CD4+ T cells in the indicated mice. (f) Compilation of S1PR1 on CD69low endogenous CD4+ T cells. (g) CD69-KO S1P-sensor+ T cells were cultured for 8h across a transwell from media or the indicated Ly6ChiCD11b+ iMo sorted from LN of pIC-treated mixed BM chimeras (either WT:CD69-KO or WT:SPHK-KO). Sensor+ cells were analyzed by confocal microscopy. Images representative of cells quantified in Fig. 2g, scale bar 5µm. (h-i) CD69-KO Sensor+ T cells were cultured for 8h across a transwell from media alone or Ly6ChiCD11b+ iMo sorted from bone marrow of PBS-treated mice, spleen of PBS-treated mice, or LN of pIC-treated mice. Sensor cells were analyzed by confocal microscopy. (h) Representative images of the cells quantified in (i). Scale bar, 5µm. (i) Quantification of S1P reporting, as in Fig. 1g. Compilation of 3 experiments. Each point is the ratio of surface GFP:RFP on one cell (media n=26, iMo BM n=60, iMo spleen n=99, iMo LN n= 75). (j-k) CD69-KO T cells were cultured across a transwell from media or sorted iMo from LN of pIC-treated WT, SPHK-KO, or CD69-KO mice. After 12h, surface S1PR1 on the CD69-KO CD4+ T cells was analyzed by flow cytometry. (j) Experiment diagram and representative histograms. (k) Compilation of 5 experiments. Each symbol represents one well relative to the average of the media control wells. Media n=7, iMo WT n=11, iMo SPHK-KO n=4, iMo CD69-KO n=7. Data presented as mean values +/− SEM. Mann-Whitney two-tailed t test.
E.D. Fig. 5: iMo require CD69 to supply S1P to T cells in the dLN.
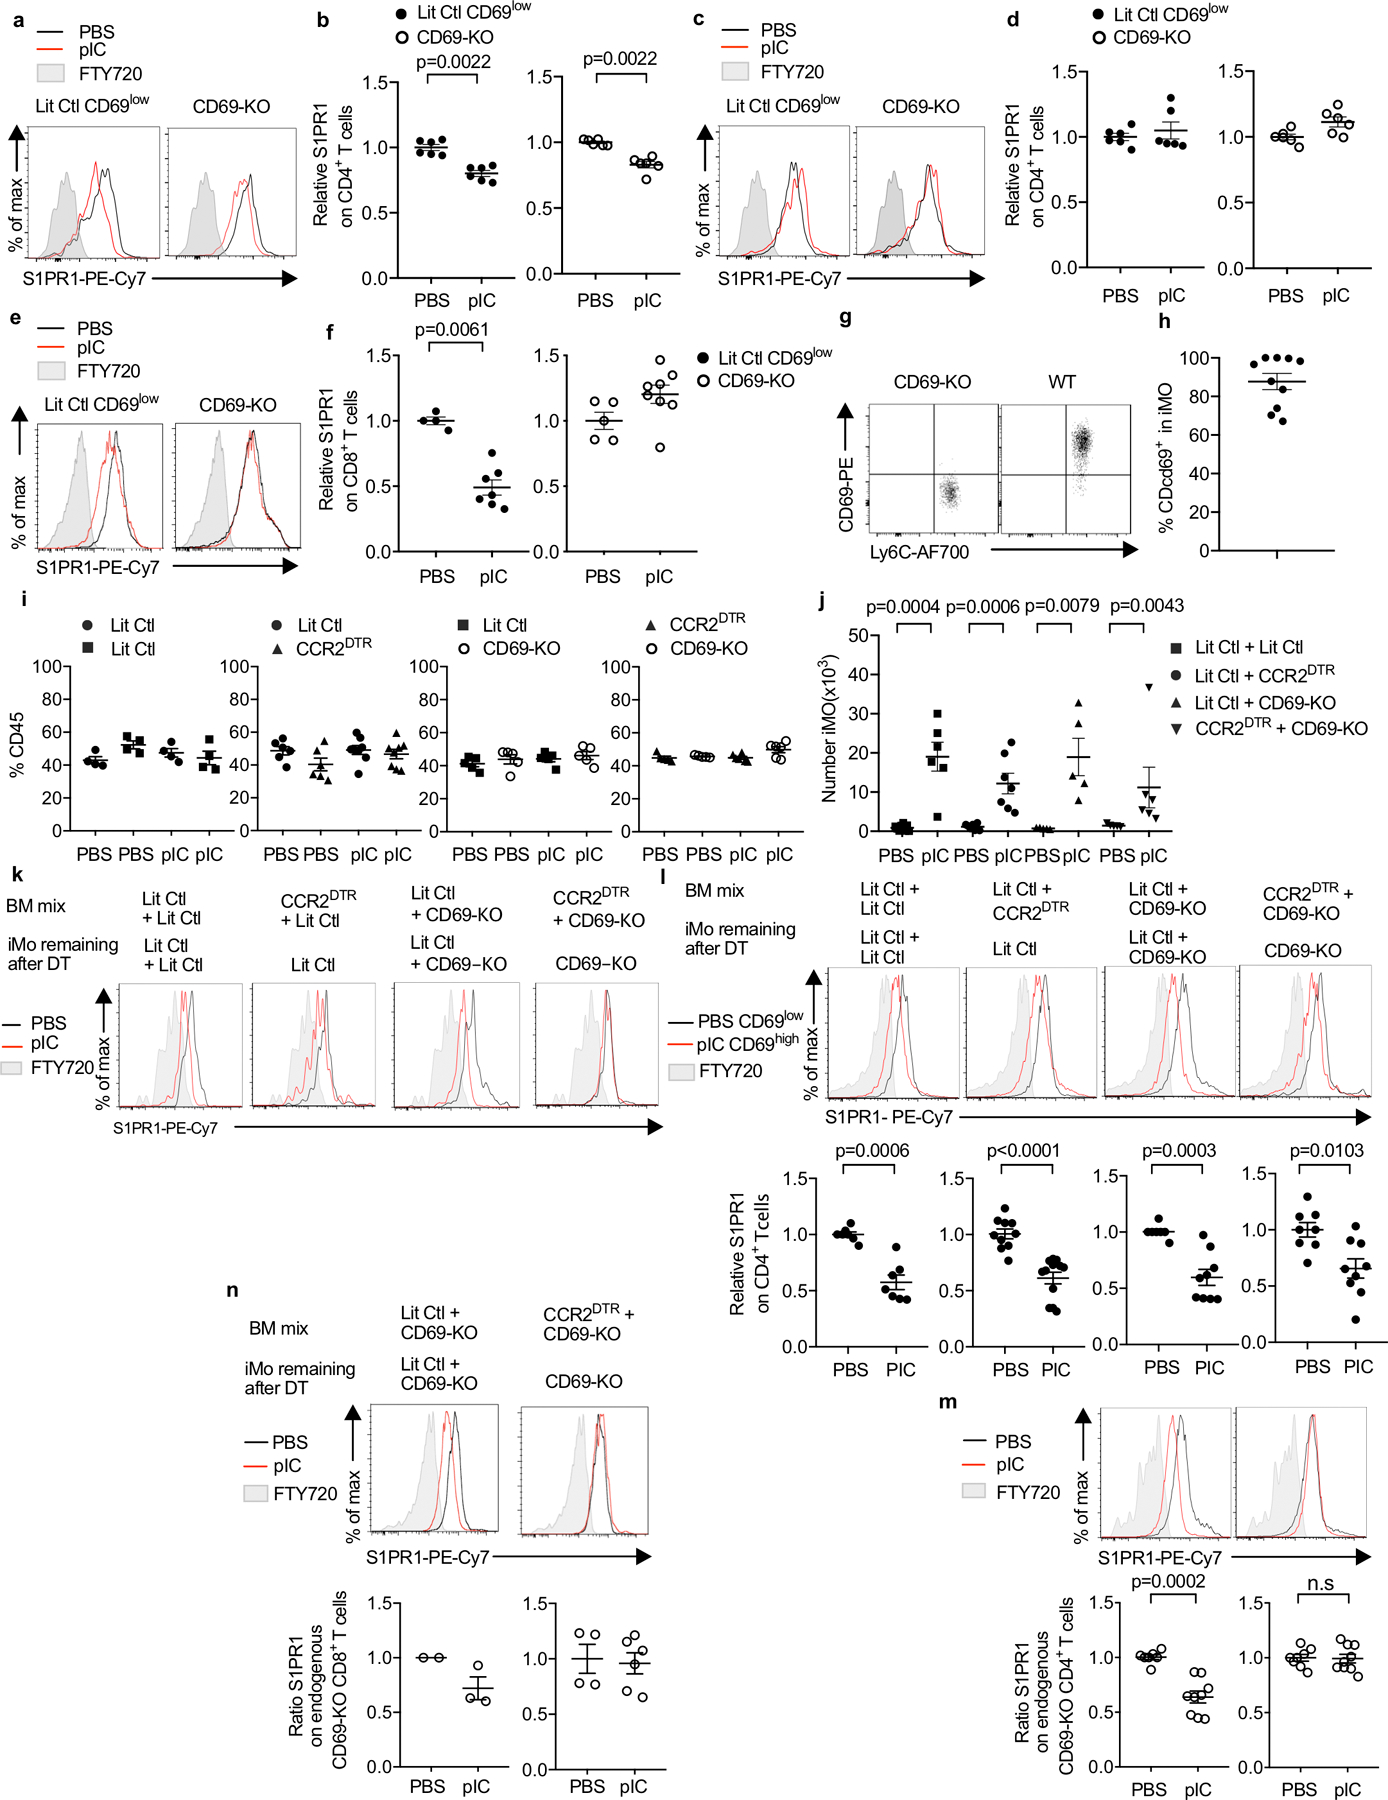
(a-b) CFSE- labeled CD69-KO or littermate control CD69low CD4 T cells were transferred i.v. into WT mice. The mice were injected s.c. with pIC or PBS, and the dLN were analyzed 14h later. (a) S1PR1 on the transferred cells, representative of the compilation in (b). (b) Compilation of 3 experiments. LitCtl (PBS n=6, pIC n=6); CD69-KO (PBS n=6, pIC n=6). (c, d) CFSE-labeled labeled CD69-KO or littermate control CD69low CD4 T cells were transferred i.v. into CD69-KO mice. The mice were injected s.c. with pIC or PBS, and the dLN were analyzed 14h later. (c) S1PR1 on the transferred cells. (d) Compilation of 3 experiments. LitCtl (PBS n=6, pIC n=6); CD69-KO (PBS n=6, pIC n=6). (e-f) CD69-KO or littermate control mice were injected s.c. with pIC or PBS, and dLN were analyzed 14h later. (e) S1PR1 on CD8+ T cells. Controls are gated on CD69low cells. (f) Compilation of 3 experiments. LitCtl (PBS n=4, pIC n=7); CD69-KO (PBS n=5, pIC n=8). (g) Dot plot of CD69 on CD11b+Ly6C+ iMo in the dLN of a WT mouse 14 hours after pIC injection. CD69-KO iMo served as a negative staining control. (h) Compilation of 4 experiments (n=10). (i-n) Lethally irradiated C57BL/6 mice were reconstituted with a 1:1 mix of the indicated BM, and analyzed 12–16 weeks later. On d0 and d2, the chimeras were treated with DT to deplete CCR2-DTR+ cells. On d1, the chimeras received CFSE-labeled CD69-KO lymphocytes i.v. On d2, the chimeras were injected s.c. with PBS or pIC, and 14h later dLN were analyzed. (i) Percent of total CD45+ cells contributed by each genotype in dLN of the indicated chimeras. Compilation of 3 experiments. LitCtl:LitCtl (PBS n=4, pIC n=4); CCR2DTR:LitCtl (PBS n=6, pIC n=8); LitCtl:CD69-KO (PBS n=5, pIC n=5); CCR2DTR:CD69-KO (PBS n=5, pIC n=6). (j) Number of iMo in the dLN of the indicated chimeras. Compilation of 3 experiments. LitCtl:LitCtl (PBS n=7, pIC n=6); CCR2DTR:LitCtl (PBS n=7, pIC n=7); LitCtl:CD69-KO (PBS n=5, pIC n=5); CCR2DTR:CD69-KO (PBS n=5, pIC n=6). (k) Representative histograms of S1PR1 expression on CD69-KO CD4 T cells in the indicated chimeras. (l) Representative histograms (top) and compilation (bottom) of S1PR1 expression on endogenous CD4 T cells in the indicated chimeras. For the compilation, the S1PR1 MFI of the CD69low CD4+ T cells in each mouse in the PBS-treated group was divided by the mean S1PR1 MFI of the CD69low CD4+ T cells in the PBS-treated group; the S1PR1 MFI of the CD69high CD4+ T cells in each mouse of the pIC-treated group was similarly divided by the mean MFI of the CD69low CD4+ T cells in the PBS-treated group. Compilation of 5 experiments. LitCtl:LitCtl (PBS n=7, pIC n=7); CCR2DTR:LitCtl (PBS n=10, pIC n=12); LitCtl:CD69-KO (PBS n=7, pIC n=9); CCR2DTR:CD69-KO (PBS n=8, pIC n=9). (m) Representative histograms of S1PR1 expression on endogenous CD69-KO CD4+ T cells in the indicated chimeras (top), and compilation of 5 experiments (bottom). LitCtl:CD69-KO (PBS n=7, pIC n=9); CCR2DTR:CD69-KO (PBS n=8, pIC n=9). (n) Representative histograms of S1PR1 expression on endogenous CD69-KO CD8+ T cells in the indicated chimeras (top), and compilation of 2 experiments (bottom) LitCtl:CD69-KO (PBS n=2, pIC n=3); CCR2DTR:CD69-KO (PBS n=4; pIC n=6). Data presented as mean values +/− SEM. Mann-Whitney two-tailed t test.
E.D. Fig. 6: Characterization of CD69-KO iMo.
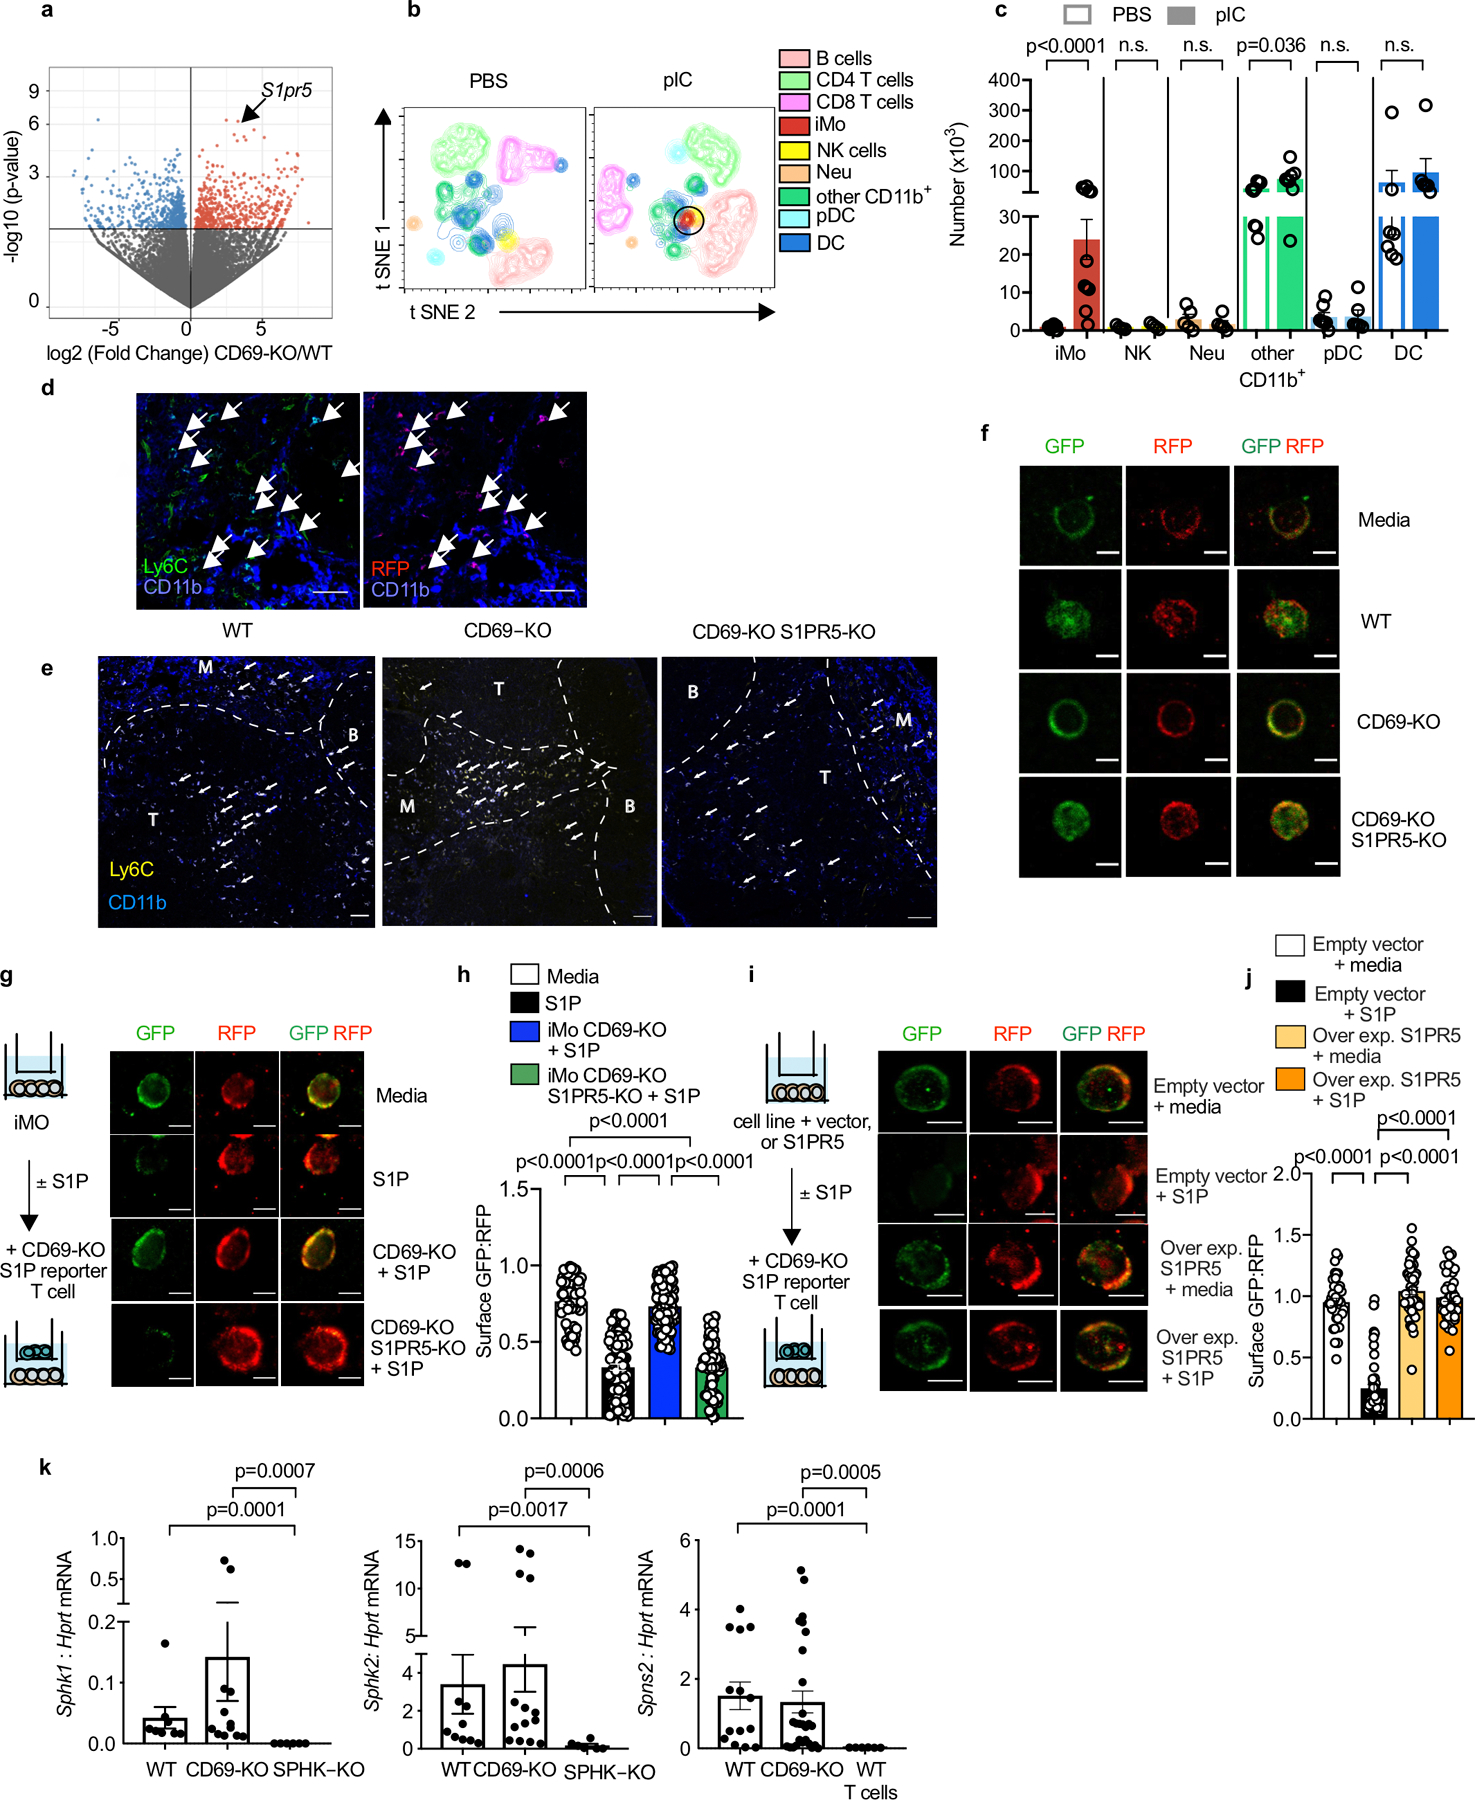
(a) Volcano plot showing transcripts from congenically marked WT and CD69-KO iMo, sorted from dLN of mixed BM chimeras (1:1 WT CD45.2:CD69-KO CD45.1 BM) 14h after pIC injection. (b-c) CD69-KO mice were injected s.c. with PBS or pIC, and dLN were analyzed 14h later. (b) Representative t-SNE plots (12-color flow cytometry). NK cells (CD3−NKp46+), B cells (CD19+), CD3+CD4+ T cells, CD3+CD8+ T cells, plasmacytoid dendritic cells (pDC) (CD11c+B220+SiglecH+), classical dendritic cells (DC) (CD11c+SiglecH−B220−), neutrophils (CD11b+Ly6G+ Ly6C−CCR2−), iMo (CD11b+ Ly6Chi CCR2+Ly6G−), and other CD11b+ cells (CD11b+Ly6G−Ly6Clow) are shown. Representative of 2 experiments. (c) Number of the indicated cells. Compilation of 5 experiments (some experiments did not include all 12 antibodies). iMo (PBS n=11, pIC n=11); NK cells (PBS n=4, pIC n=4); neutrophils (PBS n=5, pIC n=5); other CD11b+ cells (PBS n=9, pIC n=8); pDC (PBS n=7, pIC n=6); DC (PBS n=7 pIC n=6). (d) LN section from a pIC-treated CCR2-RFP mouse, stained with antibodies to Ly6C (green) and CD11b (blue). Left image shows Ly6C and CD11b, right image shows CCR2-RFP (red) and CD11b, arrows indicate double-positive cells (Ly6C+CD11b+ or CCR2-RFP CD11b+). Scale bar 50 µm. Image representative of 2 experiments. (e) Littermate control (or WT), CD69-KO and CD69-KO S1PR5-KO mice were injected with PBS or PIC s.c. 14h later, dLN were analyzed by confocal microscopy. Inflammatory monocytes (arrows) were identified as CD11b+Ly6C+. T zone, B follicles, and medulla (M) were distinguished by CD4 and Lyve1 staining. Scale bar, 50µm. LN section representative of data compiled in Fig. 3e. (f) CD69-KO S1P-sensor+ T cells were cultured for 12h across a transwell from media alone or the indicated Ly6ChiCD11b+ inflammatory monocytes sorted from LN of pIC-treated mixed BM chimeras (WT with CD69-KO, or WT with CD69-KO S1PR5-KO). Reporter cells were analyzed by confocal microscopy. Images representative of cells quantified in Fig. 3f. Scale bar, 10 µm. (g-h) The indicated sorted iMo were cultured for 5h with 50 nM S1P. Then CD69-KO S1P-sensor+ T cells were added across a transwell from the iMo for 2h. As controls, the T cells were cultured for 2h across a transwell from media alone or media + 50 nM S1P. (g) Experiment design and representative images of the cells quantified in (h). Scale bar, 5 µm. (h) Quantification of S1P reporting, as in Fig. 2g. Compilation of 4 experiments. Media (n=65), S1P (n=89), iMo CD69-KO+S1P (n=21), iMo CD69-KO S1PR5-KO+S1P (n=114). (i-j) WEHI-231 cells were transduced with S1pr5 or vector control. The S1pr5+ or control lines were cultured for 5 hours with 50 nM S1P. Then CD69-KO S1P-sensor+ T cells were added across a transwell from the WEHI-231 cultures for 2 hours. As controls, the T cells were cultured for 2 hours across a transwell from media with 50 nM S1P or media alone. (i) Experiment design and images representative of cells quantified in (j). Scale bar, 5 µm. (j) Quantification of S1P reporting, as in Fig. 2g. Compilation of 3 experiments. Empty vector (media n=39, S1P n=61); S1PR5 (media n=36, S1P n=49). (k) RT-qPCR analysis of sorted iMo from LN of pIC-treated WT, CD69-KO, and SPHK-KO mice. Sorted CD4+ T cells from WT mice served as a negative control for Spns2. Compilation of 3 experiments for Sphk1 (iMo WT n=4, iMo CD69-KO n=7, iMo SPHK-KO n=3 mice). Compilation of 4 experiments for Sphk2 (iMo WT n=6, iMo CD69-KO n=8, iMo Sphk-KO n=3 mice). Compilation of 5 experiments for Spns2 (iMo WT n=7, iMo CD69-KO n=11, WT T cells n=3 mice). For some mice, technical duplicates are included in the compilation (sorted cells were divided prior to RNA purification). Data presented as mean values +/− SEM. Mann-Whitney two-tailed t test.
E.D. Fig. 7: S1P increases in the dLN in EAE.
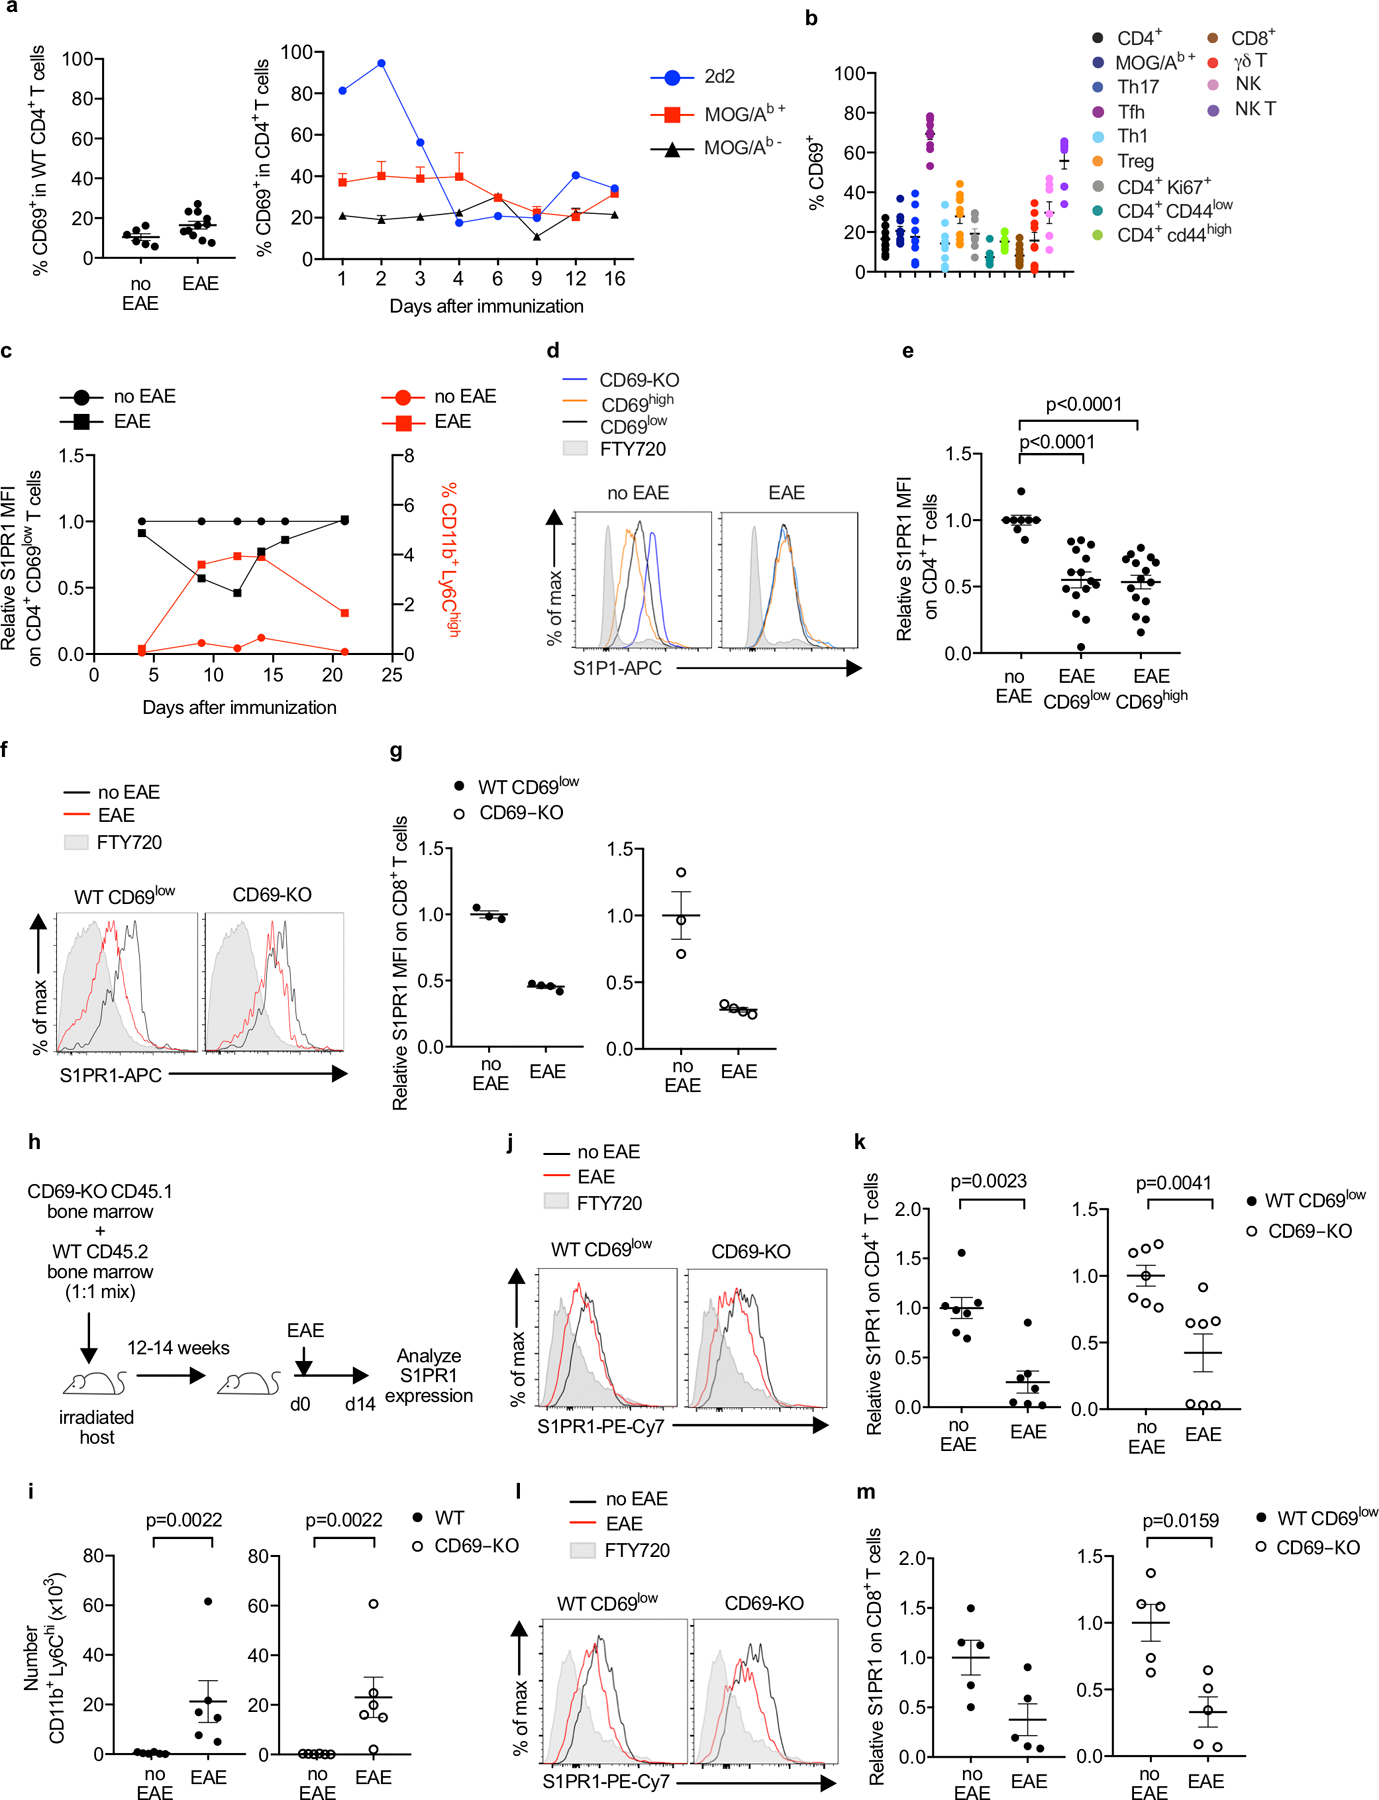
(a) (left) Percent CD69+ among total CD4 T cells in the cervical LN of healthy WT mice or WT mice with EAE (d9). Compilation of 4 experiments (no EAE n=6, EAE n=11). (right) MOG/Ab-specific 2D2 TCR-transgenic T cells were transferred i.v. to WT recipients. After EAE induction, CD69 expression on the transferred 2D2 T cells, endogenous MOG/Ab tetramer+ T cells, and endogenous MOG/Ab tetramer- T cells in the cervical LN was followed over time. Compilation of 2 experiments (3–5 mice per timepoint, 33 mice total) for endogenous cells, and 1 experiment (2–3 mice per timepoint, 18 mice total) for 2D2 T cells. (b) Percent CD69+ among total CD4+ (n=11), Tet+ (CD4+ MOG/Ab-tetramer+) (n=10), Th17 (CD4+Foxp3−Rorγt+) (n=10), Tfh (CD4+CXCR5+PD-1high) (n=9), Th1 (CD4+Foxp3−Tbet+) (n=9), Treg (CD4+Foxp3+) (n=10), CD4+ Ki67+ (n=9), CD4+CD44low (n=9), CD4+CD44high (n=9), CD8+ (n=12), γδ T (n=9), NK (NK1.1+CD3−) (n=7), and NKT (NK1.1+CD3+) (n=9) cells in the cervical LN of WT mice with EAE (d9). Compilation of 4 experiments. (c) EAE was induced in WT mice. Left axis: Kinetics of surface S1PR1 expression on CD4+CD69low T cells in the cervical LN, relative to CD4+CD69low T cells in the cervical LN of healthy controls. 1–4 mice per timepoint, no EAE n=11 mice total, EAE n=14 mice total. Right axis: iMo recruitment to the cervical LN, as a percent of total CD45+ cells. 1–4 mice per timepoint, no EAE n=8 mice total, EAE n=14 mice total. Compilation of 2 experiments. (d, e) Representative histograms (d) and compilation (e) of S1PR1 on transferred CD69-KO, endogenous CD69low, and endogenous CD69high CD4 T cells in the cervical LN of WT mice with EAE (d9-d12) or healthy controls. For the compilation, the S1PR1 MFI of endogenous CD69low or endogenous CD69high CD4+ cells in each mouse was divided by the mean S1PR1 MFI of endogenous CD69low CD4+ cells in healthy controls. Compilation of 6 experiments (no EAE n=8, EAE CD69low n=15, EAE CD69high n=15). (f, g) CD69-KO CD45.1 lymphocytes were transferred i.v. into C57BL/6 mice. The following day, EAE was induced (controls were treated with PBS). 12d-14d after EAE induction, the dLN (cervical) was analyzed. (f) Representative S1PR1 on endogenous (WT) CD69low CD8+ T cells (left) and CD69-KO CD8+ T cells (right). (g) Compilation of 2 experiments. (WT) CD69low CD8+ T cells (no EAE n=3, EAE n=4); CD69-KO CD8+ T cells (no EAE n=3, EAE n=4). (h-m) Lethally irradiated C57BL/6 mice were reconstituted with a 1:1 mix of WT and CD45.1+ CD69-KO BM, and allowed to reconstitute for 12–14 weeks. EAE was induced, or chimeras were treated with PBS. 10d-12d later, the cervical LN was analyzed. (h) Experiment diagram. (i) Number CD11b+Ly6Chi cells in the dLN. Compilation of 5 experiments. No EAE n=6, EAE n=6. (j) S1PR1 on WT CD69low (left) and CD69-KO (right) CD4+ T cells. (k) Compilation of 3 experiments. No EAE n=7, EAE n=7. (l) S1PR1 on WT CD69low (left) and CD69-KO (right) CD8+ T cells. (m) Compilation of 2 experiments. No EAE n=5, EAE n=5. Data presented as mean values +/− SEM. Mann-Whitney two-tailed t test.
E.D. Fig. 8: IMo supply S1P in the dLN during EAE.
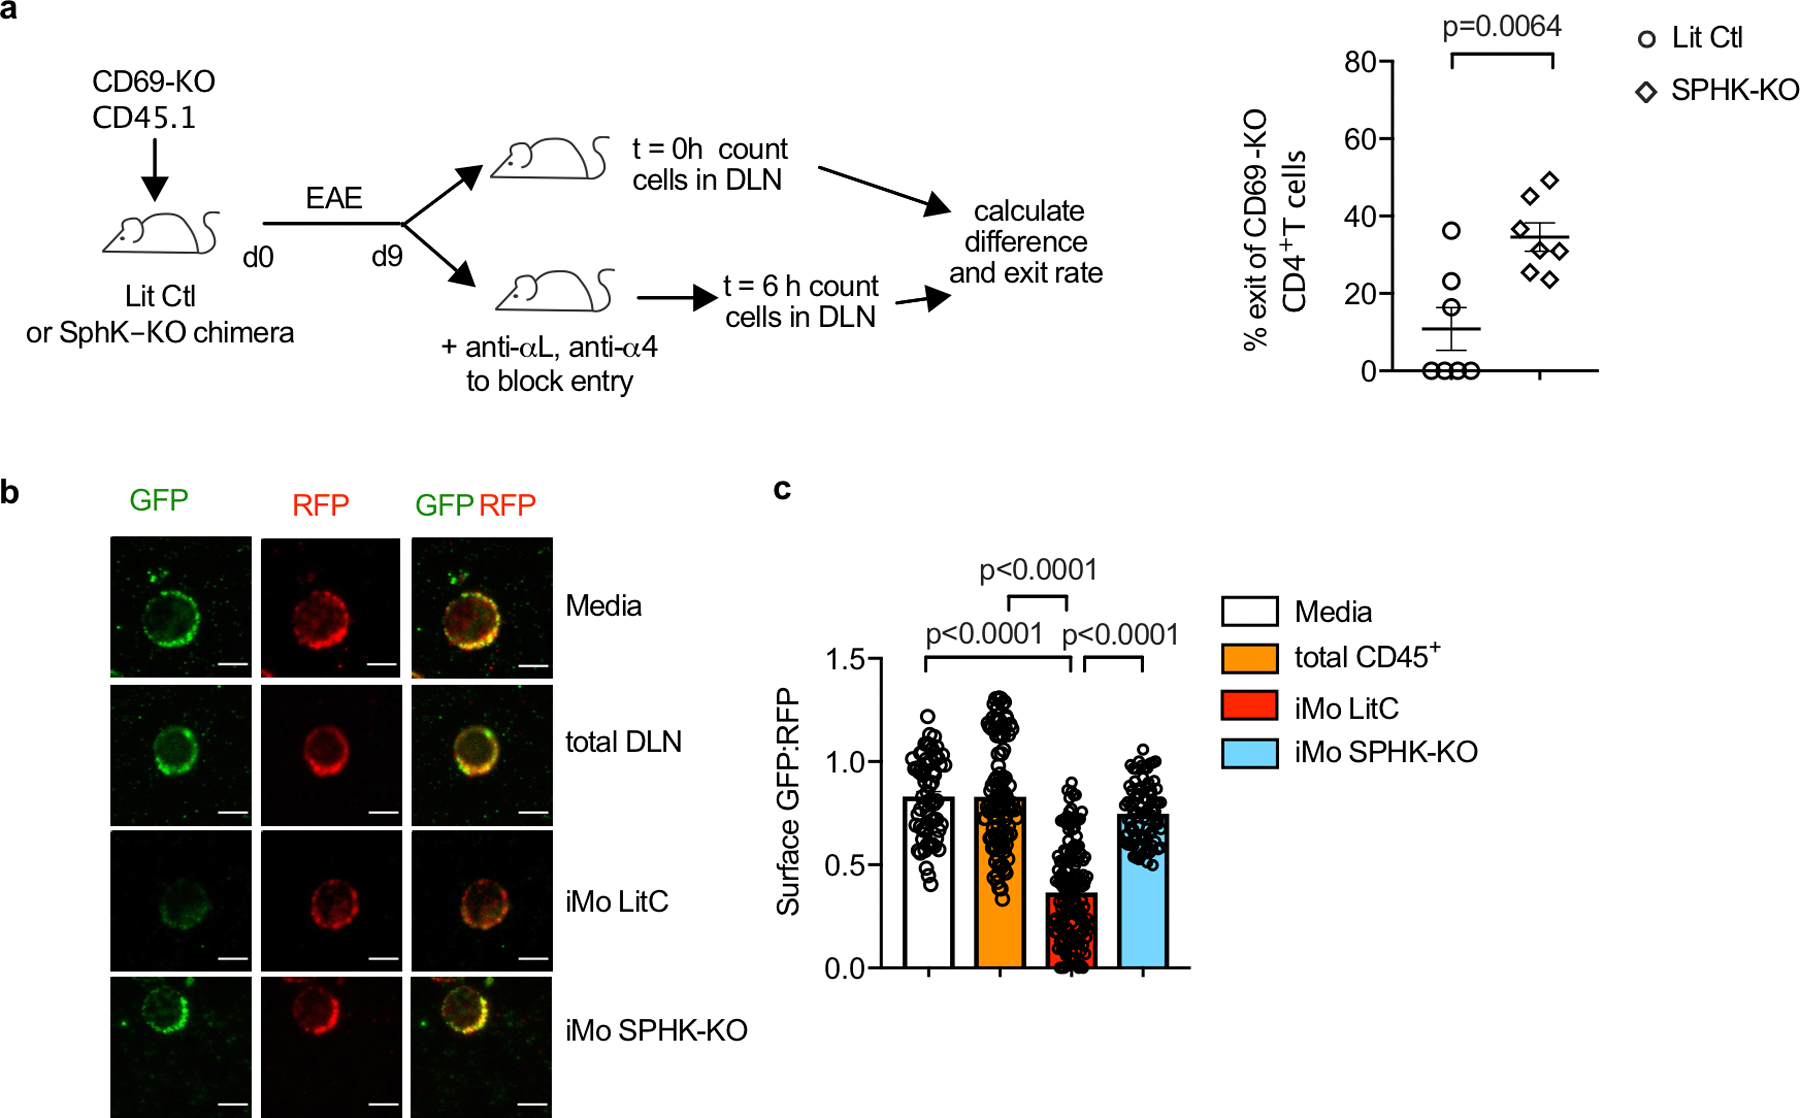
(a) Left: Experiment design to test the effect of hematopoietic S1P on T cell exit from the cervical LN in EAE. Right: Percent cells exiting the LN in 6h. Each point represents one mouse at t=6h relative to the average at t=0. Compilation of 3 experiments. LitCtl (t=0h n=5; t=6h n=7), SPHK-KO (t=0 n=6; t=6h n=7). Note that the control and SPHK-KO chimeras are at different stages of disease, so the change in T cell residence time may in part reflect differences in LN architecture. (b-c) Total CD45+ cells and CD11b+Ly6Chi iMo were sorted from the cervical LN of littermate control or SPHK-KO BM chimeras with EAE (d9). CD69-KO S1P-sensor+ T cells were cultured for 8h across a transwell from media alone or the indicated cells, and analyzed by confocal microscopy. (b) Representative images of the cells quantified in (c). Scale bar, 5µm. (c) Quantification of S1P reporting, as in Fig. 1g. Each symbol represents the ratio of surface GFP:RFP on one cell. Compilation of 2 experiments. Media (n=63), CD45+ (n=101), iMo LitCtl (n=147), iMo SPHK-KO (n=83). Data presented as mean values +/− SEM. Mann-Whitney two-tailed t test.
E.D. Fig. 9: IMo supply S1P in the dLN during EAE.
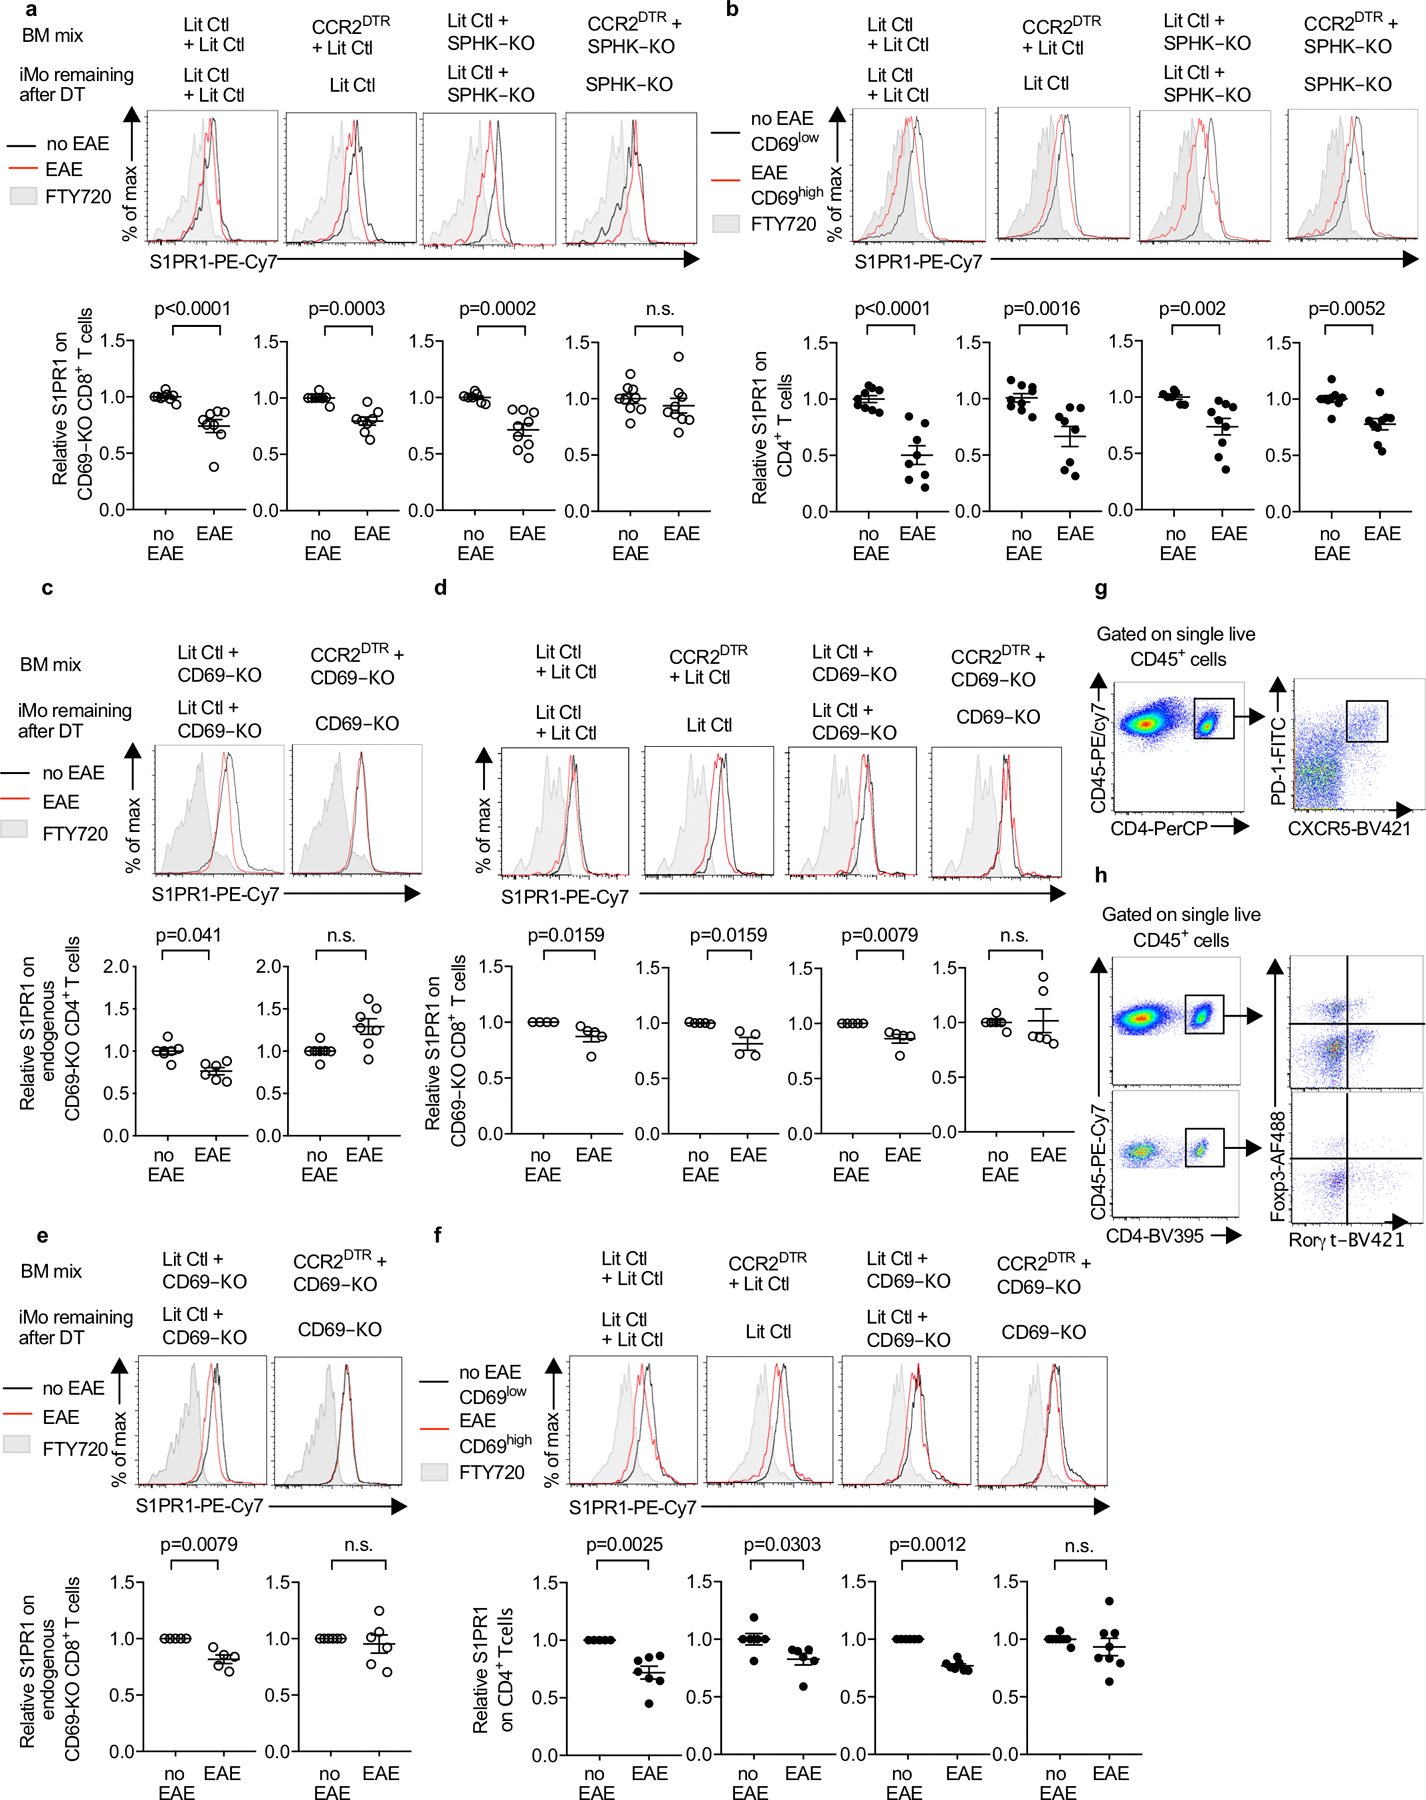
(a, b) The indicated chimeras (as in Fig. 4c) received CD69-KO CD45.1+ lymphocytes i.v. on d0. On d0 and every 3d after, they were injected i.p. with DT. On d1 EAE was induced (or mice were treated with PBS). 10d-12d later, S1PR1 levels on CD69-KO CD8+ (a) and endogenous (WT) CD4+ (b) T cells in dLN were analyzed. Top, representative histograms. Bottom, compilation of 4 experiments. LitCtl:LitCtl (PBS n=9, EAE n=8); CCR2DTR:LitCtl (PBS n=9, EAE n=8); LitCtl:SPHK-KO (PBS n=7, EAE n=9); CCR2DTR:SPHK-KO (PBS n=9, EAE n=9). For the compilation of endogenous CD4 T cells, the S1PR1 MFI of the CD69low CD4+ T cells in each mouse in the PBS-treated group was divided by the mean S1PR1 MFI of the CD69low CD4+ T cells in the PBS-treated group; the S1PR1 MFI of the CD69high CD4+ T cells in each mouse of the pIC-treated group was similarly divided by the mean MFI of the CD69low CD4+ T cells in the PBS-treated group. (c-f) The indicated chimeras (as in Fig. 4h) received CFSE-labeled CD69-KO lymphocytes i.v. on d0. On d0 and every 3d after, they were injected i.p. with DT. On d1 EAE was induced (or mice were treated with PBS). 10d-12d later, S1PR1 levels in the cervical LN were analyzed. (c) Representative histograms (top) and compilation of 4 experiments (bottom) for endogenous CD69-KO CD4+ T cells LitCtl:CD69-KO (PBS n=7, EAE n=6); CCR2DTR:CD69-KO (PBS n=7, EAE n=7). (d) Representative histograms (top) and compilation of 3 experiments (bottom) for transferred CD69-KO CD8+ T cells. LitCtl:LitCtl (PBS n=4, EAE n=5); CCR2DTR:LitCtl (PBS n=5, EAE n=4); LitCtl:CD69-KO (PBS n=5, EAE n=5); CCR2DTR:CD69-KO (PBS n=6, EAE n=6). (e) Representative histograms (top) and compilation of 3 experiments (bottom) for endogenous CD69-KO CD8+ T cells. LitCtl:CD69-KO (PBS n=5, EAE n=5); CCR2DTR:CD69-KO (PBS n=6, EAE n=6). (f) Representative histograms (top) and compilation of 4 experiments (bottom) for endogenous WT CD4+ T cells. For the compilation, the S1PR1 MFI of the CD69low CD4+ T cells in each mouse in the PBS-treated group was divided by the mean S1PR1 MFI of the CD69low CD4+ T cells in the PBS-treated group; the S1PR1 MFI of the CD69high CD4+ T cells in each mouse of the pIC-treated group was similarly divided by the mean MFI of the CD69low CD4+ T cells in the PBS-treated group. LitCtl:LitCtl (PBS n=5, EAE n=7); CCR2DTR:LitCtl (PBS n=6, EAE n=6); LitCtl:CD69-KO (PBS n=6, EAE n=7); CCR2DTR:CD69-KO (PBS n=8, EAE n=8). (g) Representative staining of CD4+PD1hiCXCR5hi Tfh cells in the dLN. (h) Representative staining of CD4+Rorγt+Foxp3− Th17 cells in the dLN (top) and in the CNS (bottom). For each graph bars represent mean +/− s.e.m. Mann-Whitney two-tailed t test.
E.D. Fig. 10: S1P regulates Tfh and Th17 numbers in EAE.
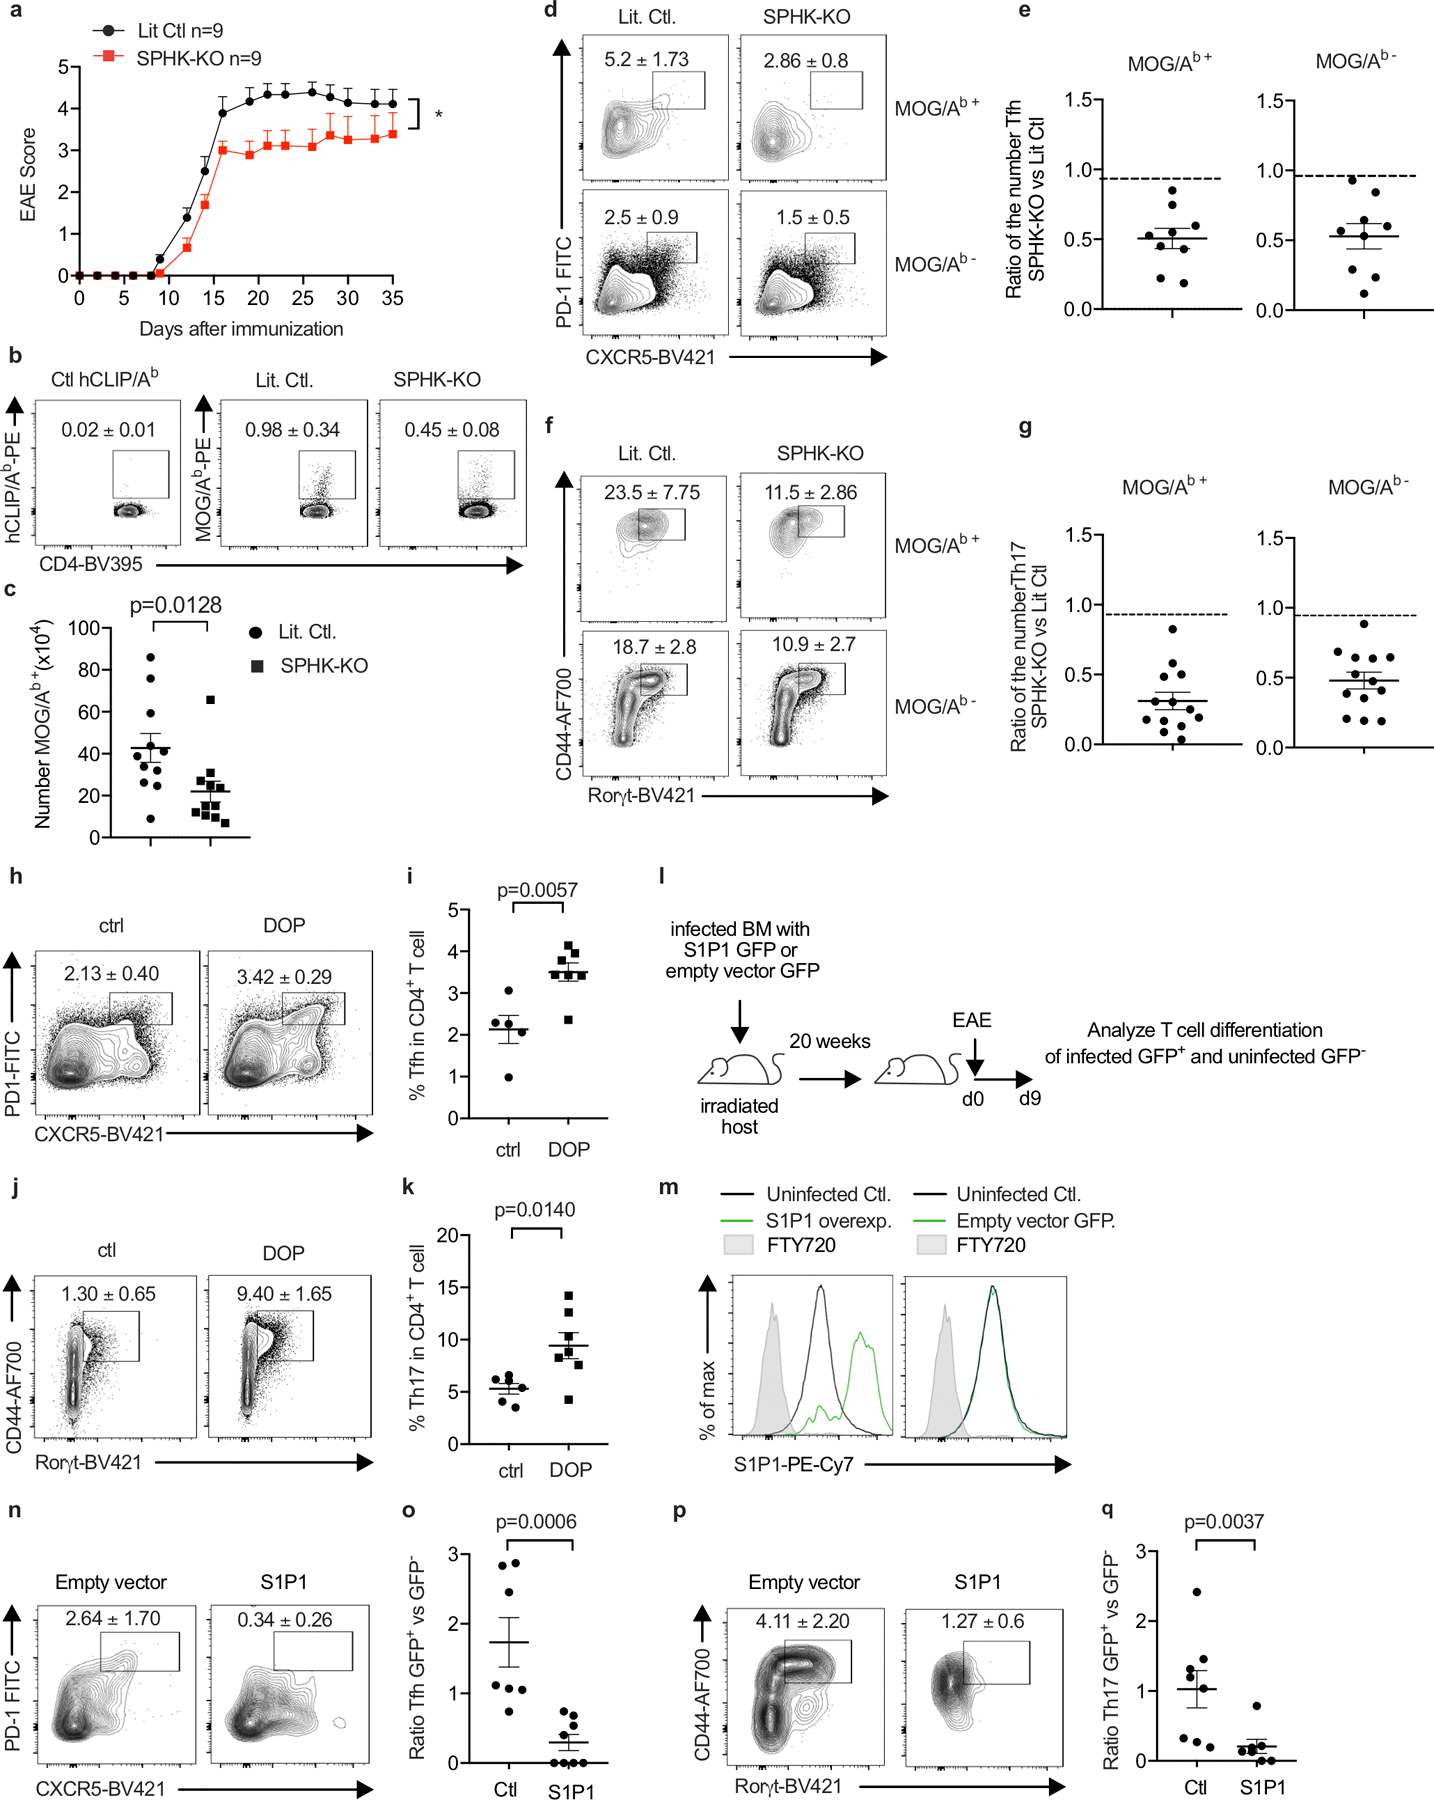
We sought to address how hematopoietic S1P regulates Tfh and Th17 accumulation in EAE. Possibilities include that this S1P may promote priming by delaying naïve T cell exit from LN; promote proliferation or differentiation by delaying activated T cell exit from LN; promote survival, proliferation, or differentiation due to residence-time independent effects of S1P signaling in T cells in LN (18, 36); or act indirectly through iMo S1P secretion in the CNS. E.D. Fig. 10 a-g report the results of experiments similar to those in Fig. 4 but using BM chimeras in which WT mice were reconstituted with SPHK-KO or littermate control BM, to avoid repeated DT injections. E.D. Fig. 10h-k report the results of experiments similar to those in Fig. 4 but using mice treated with an S1P lyase inhibitor, to test the effect of increased LN S1P. E.D. Fig. 10l-q report the results of experiments designed to distinguish effects of S1P signaling on T cell residence time from other effects. We generated T cells that over-expressed S1PR1. We expected these cells to exit tissues more quickly than control T cells(9), similar to T cells that could not ‘see’ iMo-derived S1P, while experiencing enhanced S1PR1 signaling compared to control T cells due to their higher S1PR1 levels, unlike T cells that could not ‘see’ iMo-derived S1P. We observed that over-expression of S1PR1 reduced the frequency of Th17 and Tfh cells, consistent with a cell-intrinsic effect of trafficking on T cell numbers and with previous findings (17). We also found that the influx of iMo into the cervical LN and the increased S1P peaked just prior to the onset of EAE symptoms, which is more consistent with an effect on differentiation than priming (E.D. Fig. 7c). Although not definitive, these experiments provide impetus for future research on the effect of LN residence time on T cell differentiation.
(a-g) Lethally irradiated WT mice were reconstituted with BM from pIC-treated Sphk1f/f Sphk2−/− Mx1-Cre+ (SPHK-KO) or littermate control (LitCtl) animals. 14–25 weeks after reconstitution, EAE was induced in the chimeras. T cells in the cervical LN were analyzed 9d after EAE induction. (a) Symptoms over time. LitCtl (n=9), SPHK-KO (n=9). 1 experiment. (b) Representative tetramer staining of CD4+ T cells. Number indicates mean percent tetramer+ +/− SEM. Compilation of 5 experiments. LitCtl (n=11), SPHK-KO (n=11). (c) Number tetramer+ CD4 T cells. Compilation of 5 experiments. LitCtl (n=11), SPHK-KO (n=11). (d) Representative contour plots identifying Tfh among CD4+ cells, top gated on MOG/Ab tetramer+ cells and bottom gated on MOG/Ab tetramer- cells. Number indicates mean percent Tfh +/− SEM. Compilation of 4 experiments. LitCtl (n=11), SPHK-KO (n=9). (e) Compilation of the experiments in (d), showing ratio of the number of MOG/Ab tetramer+ Tfh cells (left) and MOG/Ab tetramer− Tfh cells (right) in SPHK-KO versus littermate chimeras (each point represents the ratio of one SPHK-KO animal to the average of the LitCtl animals in the experiment). (f) Representative contour plots identifying Th17 among CD4+FoxP3− cells, top gated on MOG/Ab tetramer+ cells and bottom gated on MOG/Ab tetramer- cells. Number indicates mean percent Th17 +/− SEM from 5 experiments. LitCtl (n=13), SPHK-KO (n=13). (g) Compilation of the experiments in (f), showing ratio of the number of MOG/Ab tetramer+ Th17 cells (left) and MOG/Ab tetramer− Th17 cells (right) in SPHK-KO versus littermate chimeras (each point represents the ratio of one SPHK-KO animal to the average of the LitCtl animals in the experiment). (h-k) WT mice were treated to induce EAE. 4d after EAE induction, the S1P lyase inhibitor 4-deoxypyridoxine (DOP) was added to the drinking water. After 5d of DOP treatment, T cells in the cervical LN were analyzed. (h) Representative gating for Tfh among CD4+ T cells. Number indicates mean percent Tfh +/− SEM from 2 experiments, Ctl (n=6), DOP (n=7). (i) Compilation of 2 experiments. Ctl (n=5), DOP (n=7). (j) Representative gating for Th17 among CD4+FoxP3− T cells. Number indicates mean percent Th17 +/− SEM. Compilation of 2 experiments, Ctl (n=6), DOP (n=7). (k) Compilation of 2 experiments. Ctl (n=6); DOP (n=7) (l-q) WT BM progenitors were transduced with a vector encoding S1PR1_IRES_GFP or a control vector encoding IRES_GFP. Lethally irradiated WT hosts were reconstituted with S1PR1-overexpressing BM or control BM. Because transduction was inefficient, each mouse harbored a mix of GFP+ transduced and GFP− untransduced BM. After reconstitution, EAE was induced in the chimeras. T cells in the cervical LN were analyzed 9d after EAE induction. (l) Experiment diagram. (m) Representative histograms of S1PR1 expression by GFP+ and GFP− CD4+ cells in a mouse that received S1PR1_IRES_GFP+ BM (left) and a mouse that received IRES_GFP+ BM (right). (n) Representative contour plots showing gating for Tfh cells among GFP+ CD4 T cells in a mouse that received vector-transduced BM (left) or S1PR1-transduced BM (right). Number indicates mean percent Tfh +/− SEM, compiling 4 experiments, empty vector (n=7), S1PR1 (n=8). (o) Each point represents, for a single mouse, the ratio of the % Tfh among GFP+ CD4 T cells to the % Tfh among GFP− CD4 T cells. Compilation of 4 experiments, empty vector (n=7), S1PR1 (n=8). (p) Representative contour plots showing gating for Th17 cells among GFP+ FoxP3− CD4 T cells in a mouse that received vector-transduced BM (left) or S1PR1-transduced BM (right). Number indicates mean percent Th17 +/− SEM. Compilation of 4 experiments, empty vector (n=8), S1PR1 (n=7). (q) Each point represents, for a single mouse, the ratio of the % Th17 among GFP+ CD4 T cells to the % Th17 among GFP− CD4 T cells. Compilation of 4 experiments, empty vector (n=8), S1PR1 (n=7). Mann-Whitney two-tailed t test. For EAE curve, two-way ANOVA with Geisser-Greenhouse correction.
Supplementary Material
Acknowledgements:
We thank members of the Schwab laboratory, J. Cyster, D. Littman and K. Narasimhan for discussions; E. Pamer for the CCR2-DTR mice; and the NIH Tetramer Core Facility for the MOG/Ab and hCLIP/Ab tetramers. This work was supported by NIH grants R01AI085166 and R01AI123308, and the Blood Cancer Discoveries Grant Program sponsored by the Leukemia & Lymphoma Society, the Mark Foundation for Cancer Research and The Paul G. Allen Frontiers Group (to S.R.S.). NYU’s core facilities were supported in part by NIH grants P30CA016087 to the Laura and Isaac Perlmutter Cancer Center and NCRR S10RR023704-01A1. This work is dedicated to Nilabh Shastri.
Footnotes
Competing interests:
The authors declare no competing interests.
Additional information:
Correspondence and requests for materials should be addressed to Susan Schwab, susan.schwab@med.nyu.edu.
Code availability:
The ImageJ macro used for inflammatory monocyte localization is provided in Supplementary Information.
Data availability:
RNA-Seq data are available from NIH/NCBI as Gene Expression Omnibus (GEO) dataset GSE139006. All other data will be available from the authors upon reasonable request.
References:
- 1.Baeyens AAL, Schwab SR. 2020. Finding a Way Out: S1P Signaling and Immune Cell Migration. Annu Rev Immunol 38: 759–84 [DOI] [PubMed] [Google Scholar]
- 2.Olivera A, Allende ML, Proia RL. 2013. Shaping the landscape: Metabolic regulation of S1P gradients. Biochimica et biophysica acta 1831: 193–202 [DOI] [PMC free article] [PubMed] [Google Scholar]
- 3.Yanagida K, Hla T. 2017. Vascular and Immunobiology of the Circulatory Sphingosine 1-Phosphate Gradient. Annu Rev Physiol 79: 67–91 [DOI] [PMC free article] [PubMed] [Google Scholar]
- 4.Liu CH, Thangada S, Lee MJ, Van Brocklyn JR, Spiegel S, Hla T. 1999. Ligand-induced trafficking of the sphingosine-1-phosphate receptor EDG-1. Mol Biol Cell 10: 1179–90 [DOI] [PMC free article] [PubMed] [Google Scholar]
- 5.Bankovich AJ, Shiow LR, Cyster JG. 2010. CD69 suppresses sphingosine 1-phosophate receptor-1 (S1P1) function through interaction with membrane helix 4. J Biol Chem 285: 22328–37 [DOI] [PMC free article] [PubMed] [Google Scholar]
- 6.Shiow LR, Rosen DB, Brdickova N, Xu Y, An J, Lanier LL, Cyster JG, Matloubian M. 2006. CD69 acts downstream of interferon-alpha/beta to inhibit S1P1 and lymphocyte egress from lymphoid organs. Nature 440: 540–4 [DOI] [PubMed] [Google Scholar]
- 7.Fang V, Chaluvadi VS, Ramos-Perez WD, Mendoza A, Baeyens A, Rivera R, Chun J, Cammer M, Schwab SR. 2017. Gradients of the signaling lipid S1P in lymph nodes position natural killer cells and regulate their interferon-gamma response. Nat Immunol 18: 15–25 [DOI] [PMC free article] [PubMed] [Google Scholar]
- 8.Ramos-Perez WD, Fang V, Escalante-Alcalde D, Cammer M, Schwab SR. 2015. A map of the distribution of sphingosine 1-phosphate in the spleen. Nat Immunol 16: 1245–52 [DOI] [PMC free article] [PubMed] [Google Scholar]
- 9.Lo CG, Xu Y, Proia RL, Cyster JG. 2005. Cyclical modulation of sphingosine-1-phosphate receptor 1 surface expression during lymphocyte recirculation and relationship to lymphoid organ transit. J Exp Med 201: 291–301 [DOI] [PMC free article] [PubMed] [Google Scholar]
- 10.Jakubzick CV, Randolph GJ, Henson PM. 2017. Monocyte differentiation and antigen-presenting functions. Nat Rev Immunol 17: 349–62 [DOI] [PubMed] [Google Scholar]
- 11.Hohl TM, Rivera A, Lipuma L, Gallegos A, Shi C, Mack M, Pamer EG. 2009. Inflammatory monocytes facilitate adaptive CD4 T cell responses during respiratory fungal infection. Cell Host Microbe 6: 470–81 [DOI] [PMC free article] [PubMed] [Google Scholar]
- 12.Cibrian D, Sanchez-Madrid F. 2017. CD69: from activation marker to metabolic gatekeeper. Eur J Immunol 47: 946–53 [DOI] [PMC free article] [PubMed] [Google Scholar]
- 13.Kimura MY, Hayashizaki K, Tokoyoda K, Takamura S, Motohashi S, Nakayama T. 2017. Crucial role for CD69 in allergic inflammatory responses: CD69-Myl9 system in the pathogenesis of airway inflammation. Immunol Rev 278: 87–100 [DOI] [PubMed] [Google Scholar]
- 14.Xiong H, Pamer EG. 2015. Monocytes and infection: modulator, messenger and effector. Immunobiology 220: 210–4 [DOI] [PMC free article] [PubMed] [Google Scholar]
- 15.Geissmann F, Manz MG, Jung S, Sieweke MH, Merad M, Ley K. 2010. Development of monocytes, macrophages, and dendritic cells. Science 327: 656–61 [DOI] [PMC free article] [PubMed] [Google Scholar]
- 16.Kono M, Tucker AE, Tran J, Bergner JB, Turner EM, Proia RL. 2014. Sphingosine-1-phosphate receptor 1 reporter mice reveal receptor activation sites in vivo. J Clin Invest 124: 2076–86 [DOI] [PMC free article] [PubMed] [Google Scholar]
- 17.Lee JY, Skon CN, Lee YJ, Oh S, Taylor JJ, Malhotra D, Jenkins MK, Rosenfeld MG, Hogquist KA, Jameson SC. 2015. The transcription factor KLF2 restrains CD4(+) T follicular helper cell differentiation. Immunity 42: 252–64 [DOI] [PMC free article] [PubMed] [Google Scholar]
- 18.Garris CS, Blaho VA, Hla T, Han MH. 2014. Sphingosine-1-phosphate receptor 1 signalling in T cells: trafficking and beyond. Immunology 142: 347–53 [DOI] [PMC free article] [PubMed] [Google Scholar]
- 19.Hatcher SE, Waubant E, Nourbakhsh B, Crabtree-Hartman E, Graves JS. 2016. Rebound Syndrome in Patients With Multiple Sclerosis After Cessation of Fingolimod Treatment. JAMA Neurol 73: 790–4 [DOI] [PubMed] [Google Scholar]
Additional References for Methods:
- 20.Murata K, Inami M, Hasegawa A, Kubo S, Kimura M, Yamashita M, Hosokawa H, Nagao T, Suzuki K, Hashimoto K, Shinkai H, Koseki H, Taniguchi M, Ziegler SF, Nakayama T. 2003. CD69-null mice protected from arthritis induced with anti-type II collagen antibodies. Int Immunol 15: 987–92 [DOI] [PubMed] [Google Scholar]
- 21.Schaefer BC, Schaefer ML, Kappler JW, Marrack P, Kedl RM. 2001. Observation of antigen-dependent CD8+ T-cell/dendritic cell interactions in vivo. Cellular immunology 214: 110–22 [DOI] [PubMed] [Google Scholar]
- 22.Pappu R, Schwab SR, Cornelissen I, Pereira JP, Regard JB, Xu Y, Camerer E, Zheng YW, Huang Y, Cyster JG, Coughlin SR. 2007. Promotion of lymphocyte egress into blood and lymph by distinct sources of sphingosine-1-phosphate. Science 316: 295–8 [DOI] [PubMed] [Google Scholar]
- 23.Mizugishi K, Yamashita T, Olivera A, Miller GF, Spiegel S, Proia RL. 2005. Essential role for sphingosine kinases in neural and vascular development. Mol Cell Biol 25: 11113–21 [DOI] [PMC free article] [PubMed] [Google Scholar]
- 24.Kuhn R, Schwenk F, Aguet M, Rajewsky K. 1995. Inducible gene targeting in mice. Science 269: 1427–9 [DOI] [PubMed] [Google Scholar]
- 25.Jenne CN, Enders A, Rivera R, Watson SR, Bankovich AJ, Pereira JP, Xu Y, Roots CM, Beilke JN, Banerjee A, Reiner SL, Miller SA, Weinmann AS, Goodnow CC, Lanier LL, Cyster JG, Chun J. 2009. T-bet-dependent S1P5 expression in NK cells promotes egress from lymph nodes and bone marrow. J Exp Med 206: 2469–81 [DOI] [PMC free article] [PubMed] [Google Scholar]
- 26.Allende ML, Sasaki T, Kawai H, Olivera A, Mi Y, van Echten-Deckert G, Hajdu R, Rosenbach M, Keohane CA, Mandala S, Spiegel S, Proia RL. 2004. Mice deficient in sphingosine kinase 1 are rendered lymphopenic by FTY720. J Biol Chem 279: 52487–92 [DOI] [PubMed] [Google Scholar]
- 27.Saederup N, Cardona AE, Croft K, Mizutani M, Cotleur AC, Tsou CL, Ransohoff RM, Charo IF. 2010. Selective chemokine receptor usage by central nervous system myeloid cells in CCR2-red fluorescent protein knock-in mice. PLoS One 5: e13693. [DOI] [PMC free article] [PubMed] [Google Scholar]
- 28.Tepper RI, Coffman RL, Leder P. 1992. An eosinophil-dependent mechanism for the antitumor effect of interleukin-4. Science 257: 548–51 [DOI] [PubMed] [Google Scholar]
- 29.Xiong H, Keith JW, Samilo DW, Carter RA, Leiner IM, Pamer EG. 2016. Innate Lymphocyte/Ly6C(hi) Monocyte Crosstalk Promotes Klebsiella Pneumoniae Clearance. Cell 165: 679–89 [DOI] [PMC free article] [PubMed] [Google Scholar]
- 30.Johansen P, Kundig TM. 2014. Intralymphatic immunotherapy and vaccination in mice. J Vis Exp: e51031. [DOI] [PMC free article] [PubMed] [Google Scholar]
- 31.Andorko JI, Tostanoski LH, Solano E, Mukhamedova M, Jewell CM. 2014. Intra-lymph node injection of biodegradable polymer particles. J Vis Exp: e50984. [DOI] [PMC free article] [PubMed] [Google Scholar]
- 32.Dobin A, Davis CA, Schlesinger F, Drenkow J, Zaleski C, Jha S, Batut P, Chaisson M, Gingeras TR. 2013. STAR: ultrafast universal RNA-seq aligner. Bioinformatics 29: 15–21 [DOI] [PMC free article] [PubMed] [Google Scholar]
- 33.Anders S, Pyl PT, Huber W. 2015. HTSeq--a Python framework to work with high-throughput sequencing data. Bioinformatics 31: 166–9 [DOI] [PMC free article] [PubMed] [Google Scholar]
- 34.Love MI, Huber W, Anders S. 2014. Moderated estimation of fold change and dispersion for RNA-seq data with DESeq2. Genome Biol 15: 550. [DOI] [PMC free article] [PubMed] [Google Scholar]
- 35.Quinlan AR, Hall IM. 2010. BEDTools: a flexible suite of utilities for comparing genomic features. Bioinformatics 26: 841–2 [DOI] [PMC free article] [PubMed] [Google Scholar]
- 36.Chi H 2011. Sphingosine-1-phosphate and immune regulation: trafficking and beyond. Trends Pharmacol Sci 32: 16–24 [DOI] [PMC free article] [PubMed] [Google Scholar]
Associated Data
This section collects any data citations, data availability statements, or supplementary materials included in this article.
Supplementary Materials
Data Availability Statement
RNA-Seq data are available from NIH/NCBI as Gene Expression Omnibus (GEO) dataset GSE139006. All other data will be available from the authors upon reasonable request.


