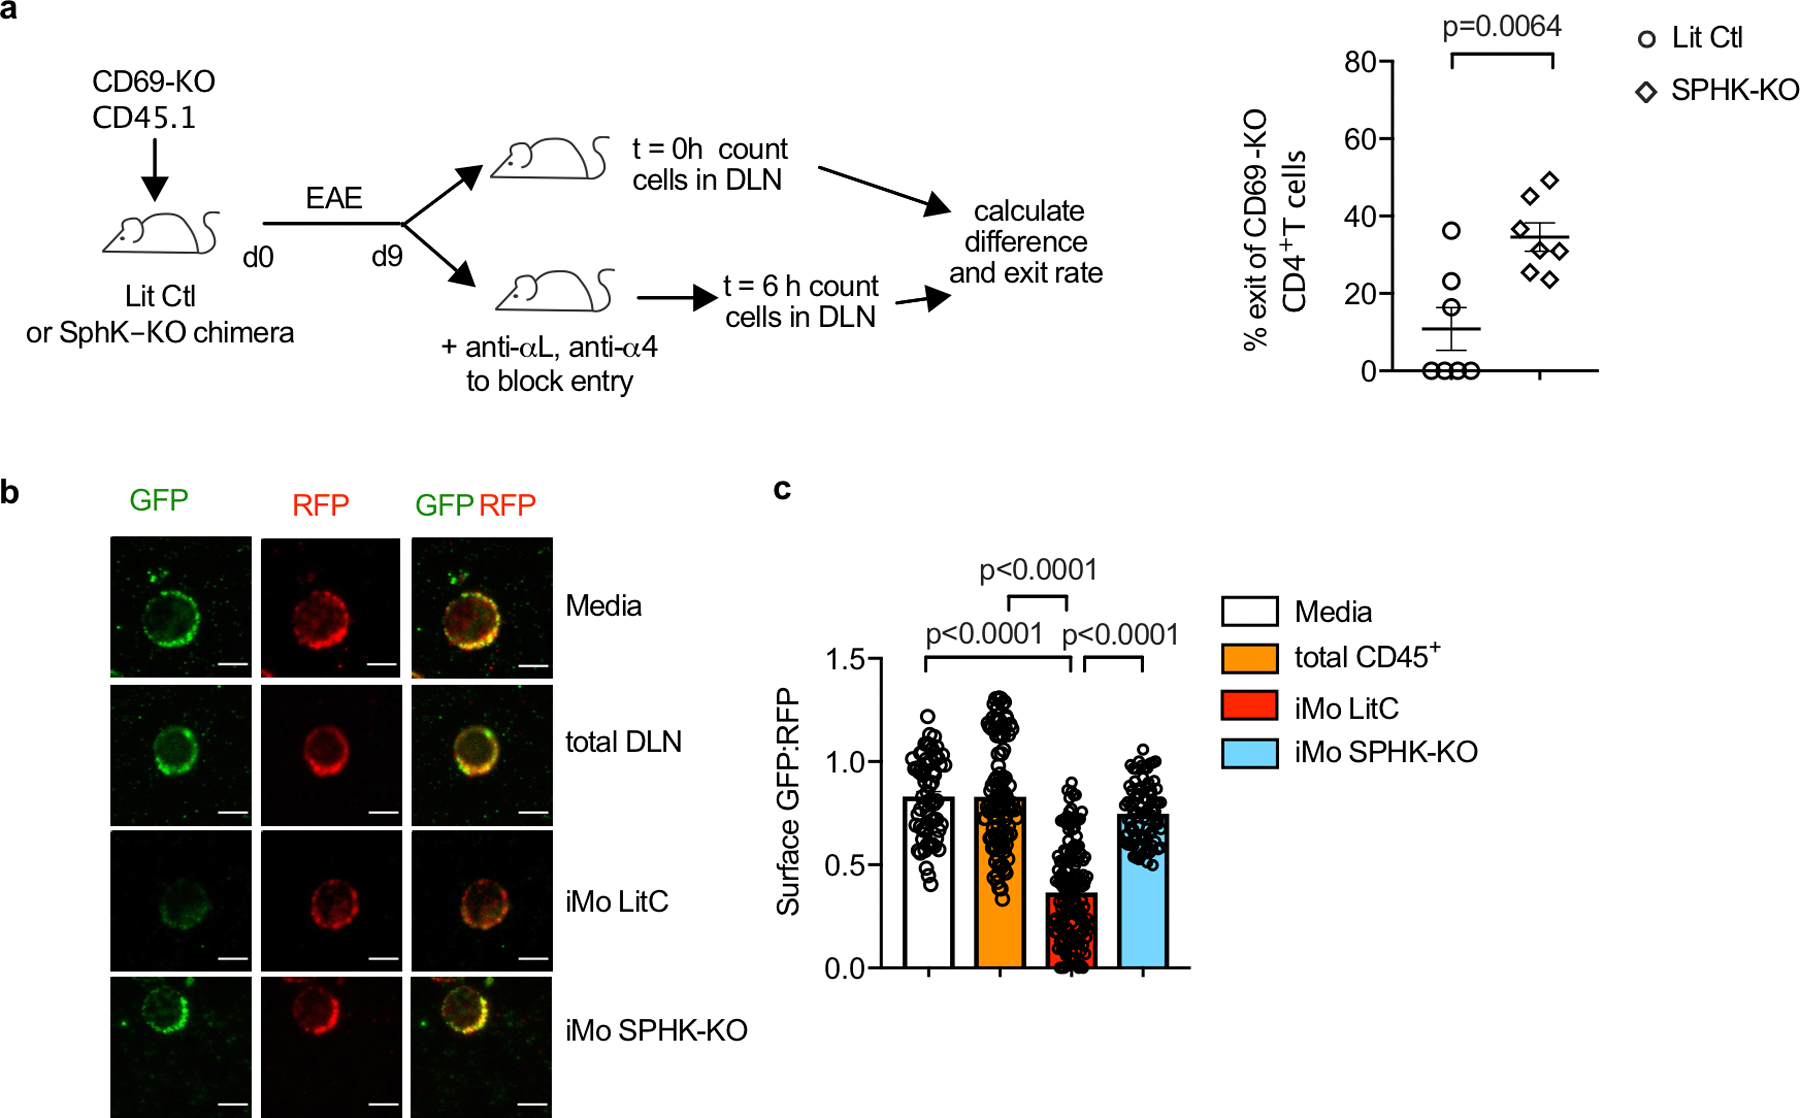
E.D. Fig. 8: IMo supply S1P in the dLN during EAE.

(a) Left: Experiment design to test the effect of hematopoietic S1P on T cell exit from the cervical LN in EAE. Right: Percent cells exiting the LN in 6h. Each point represents one mouse at t=6h relative to the average at t=0. Compilation of 3 experiments. LitCtl (t=0h n=5; t=6h n=7), SPHK-KO (t=0 n=6; t=6h n=7). Note that the control and SPHK-KO chimeras are at different stages of disease, so the change in T cell residence time may in part reflect differences in LN architecture. (b-c) Total CD45+ cells and CD11b+Ly6Chi iMo were sorted from the cervical LN of littermate control or SPHK-KO BM chimeras with EAE (d9). CD69-KO S1P-sensor+ T cells were cultured for 8h across a transwell from media alone or the indicated cells, and analyzed by confocal microscopy. (b) Representative images of the cells quantified in (c). Scale bar, 5µm. (c) Quantification of S1P reporting, as in Fig. 1g. Each symbol represents the ratio of surface GFP:RFP on one cell. Compilation of 2 experiments. Media (n=63), CD45+ (n=101), iMo LitCtl (n=147), iMo SPHK-KO (n=83). Data presented as mean values +/− SEM. Mann-Whitney two-tailed t test.
