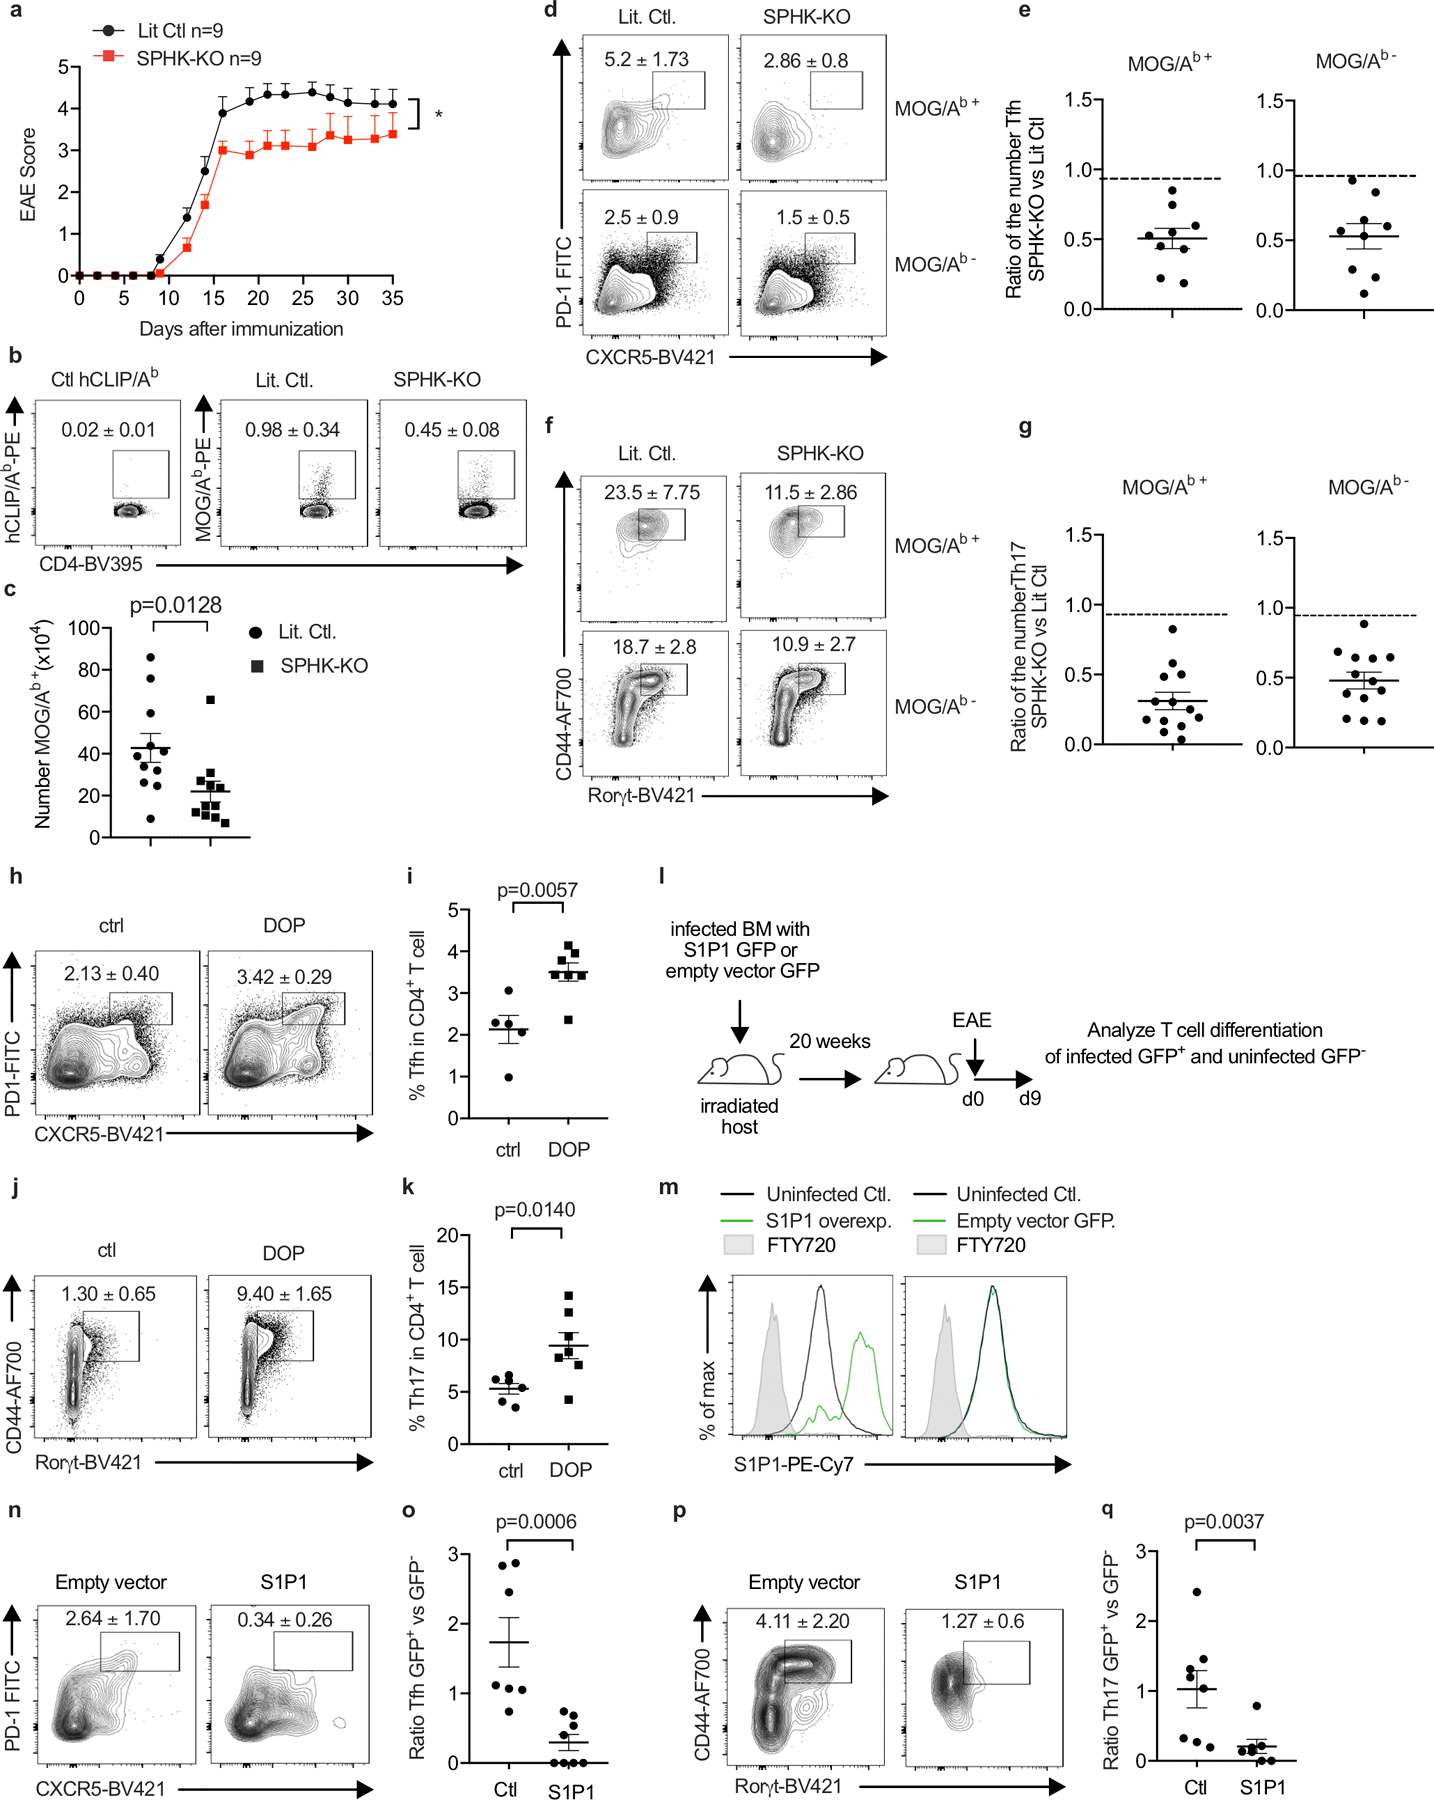
E.D. Fig. 10: S1P regulates Tfh and Th17 numbers in EAE.

We sought to address how hematopoietic S1P regulates Tfh and Th17 accumulation in EAE. Possibilities include that this S1P may promote priming by delaying naïve T cell exit from LN; promote proliferation or differentiation by delaying activated T cell exit from LN; promote survival, proliferation, or differentiation due to residence-time independent effects of S1P signaling in T cells in LN (18, 36); or act indirectly through iMo S1P secretion in the CNS. E.D. Fig. 10 a-g report the results of experiments similar to those in Fig. 4 but using BM chimeras in which WT mice were reconstituted with SPHK-KO or littermate control BM, to avoid repeated DT injections. E.D. Fig. 10h-k report the results of experiments similar to those in Fig. 4 but using mice treated with an S1P lyase inhibitor, to test the effect of increased LN S1P. E.D. Fig. 10l-q report the results of experiments designed to distinguish effects of S1P signaling on T cell residence time from other effects. We generated T cells that over-expressed S1PR1. We expected these cells to exit tissues more quickly than control T cells(9), similar to T cells that could not ‘see’ iMo-derived S1P, while experiencing enhanced S1PR1 signaling compared to control T cells due to their higher S1PR1 levels, unlike T cells that could not ‘see’ iMo-derived S1P. We observed that over-expression of S1PR1 reduced the frequency of Th17 and Tfh cells, consistent with a cell-intrinsic effect of trafficking on T cell numbers and with previous findings (17). We also found that the influx of iMo into the cervical LN and the increased S1P peaked just prior to the onset of EAE symptoms, which is more consistent with an effect on differentiation than priming (E.D. Fig. 7c). Although not definitive, these experiments provide impetus for future research on the effect of LN residence time on T cell differentiation.
(a-g) Lethally irradiated WT mice were reconstituted with BM from pIC-treated Sphk1f/f Sphk2−/− Mx1-Cre+ (SPHK-KO) or littermate control (LitCtl) animals. 14–25 weeks after reconstitution, EAE was induced in the chimeras. T cells in the cervical LN were analyzed 9d after EAE induction. (a) Symptoms over time. LitCtl (n=9), SPHK-KO (n=9). 1 experiment. (b) Representative tetramer staining of CD4+ T cells. Number indicates mean percent tetramer+ +/− SEM. Compilation of 5 experiments. LitCtl (n=11), SPHK-KO (n=11). (c) Number tetramer+ CD4 T cells. Compilation of 5 experiments. LitCtl (n=11), SPHK-KO (n=11). (d) Representative contour plots identifying Tfh among CD4+ cells, top gated on MOG/Ab tetramer+ cells and bottom gated on MOG/Ab tetramer- cells. Number indicates mean percent Tfh +/− SEM. Compilation of 4 experiments. LitCtl (n=11), SPHK-KO (n=9). (e) Compilation of the experiments in (d), showing ratio of the number of MOG/Ab tetramer+ Tfh cells (left) and MOG/Ab tetramer− Tfh cells (right) in SPHK-KO versus littermate chimeras (each point represents the ratio of one SPHK-KO animal to the average of the LitCtl animals in the experiment). (f) Representative contour plots identifying Th17 among CD4+FoxP3− cells, top gated on MOG/Ab tetramer+ cells and bottom gated on MOG/Ab tetramer- cells. Number indicates mean percent Th17 +/− SEM from 5 experiments. LitCtl (n=13), SPHK-KO (n=13). (g) Compilation of the experiments in (f), showing ratio of the number of MOG/Ab tetramer+ Th17 cells (left) and MOG/Ab tetramer− Th17 cells (right) in SPHK-KO versus littermate chimeras (each point represents the ratio of one SPHK-KO animal to the average of the LitCtl animals in the experiment). (h-k) WT mice were treated to induce EAE. 4d after EAE induction, the S1P lyase inhibitor 4-deoxypyridoxine (DOP) was added to the drinking water. After 5d of DOP treatment, T cells in the cervical LN were analyzed. (h) Representative gating for Tfh among CD4+ T cells. Number indicates mean percent Tfh +/− SEM from 2 experiments, Ctl (n=6), DOP (n=7). (i) Compilation of 2 experiments. Ctl (n=5), DOP (n=7). (j) Representative gating for Th17 among CD4+FoxP3− T cells. Number indicates mean percent Th17 +/− SEM. Compilation of 2 experiments, Ctl (n=6), DOP (n=7). (k) Compilation of 2 experiments. Ctl (n=6); DOP (n=7) (l-q) WT BM progenitors were transduced with a vector encoding S1PR1_IRES_GFP or a control vector encoding IRES_GFP. Lethally irradiated WT hosts were reconstituted with S1PR1-overexpressing BM or control BM. Because transduction was inefficient, each mouse harbored a mix of GFP+ transduced and GFP− untransduced BM. After reconstitution, EAE was induced in the chimeras. T cells in the cervical LN were analyzed 9d after EAE induction. (l) Experiment diagram. (m) Representative histograms of S1PR1 expression by GFP+ and GFP− CD4+ cells in a mouse that received S1PR1_IRES_GFP+ BM (left) and a mouse that received IRES_GFP+ BM (right). (n) Representative contour plots showing gating for Tfh cells among GFP+ CD4 T cells in a mouse that received vector-transduced BM (left) or S1PR1-transduced BM (right). Number indicates mean percent Tfh +/− SEM, compiling 4 experiments, empty vector (n=7), S1PR1 (n=8). (o) Each point represents, for a single mouse, the ratio of the % Tfh among GFP+ CD4 T cells to the % Tfh among GFP− CD4 T cells. Compilation of 4 experiments, empty vector (n=7), S1PR1 (n=8). (p) Representative contour plots showing gating for Th17 cells among GFP+ FoxP3− CD4 T cells in a mouse that received vector-transduced BM (left) or S1PR1-transduced BM (right). Number indicates mean percent Th17 +/− SEM. Compilation of 4 experiments, empty vector (n=8), S1PR1 (n=7). (q) Each point represents, for a single mouse, the ratio of the % Th17 among GFP+ CD4 T cells to the % Th17 among GFP− CD4 T cells. Compilation of 4 experiments, empty vector (n=8), S1PR1 (n=7). Mann-Whitney two-tailed t test. For EAE curve, two-way ANOVA with Geisser-Greenhouse correction.
