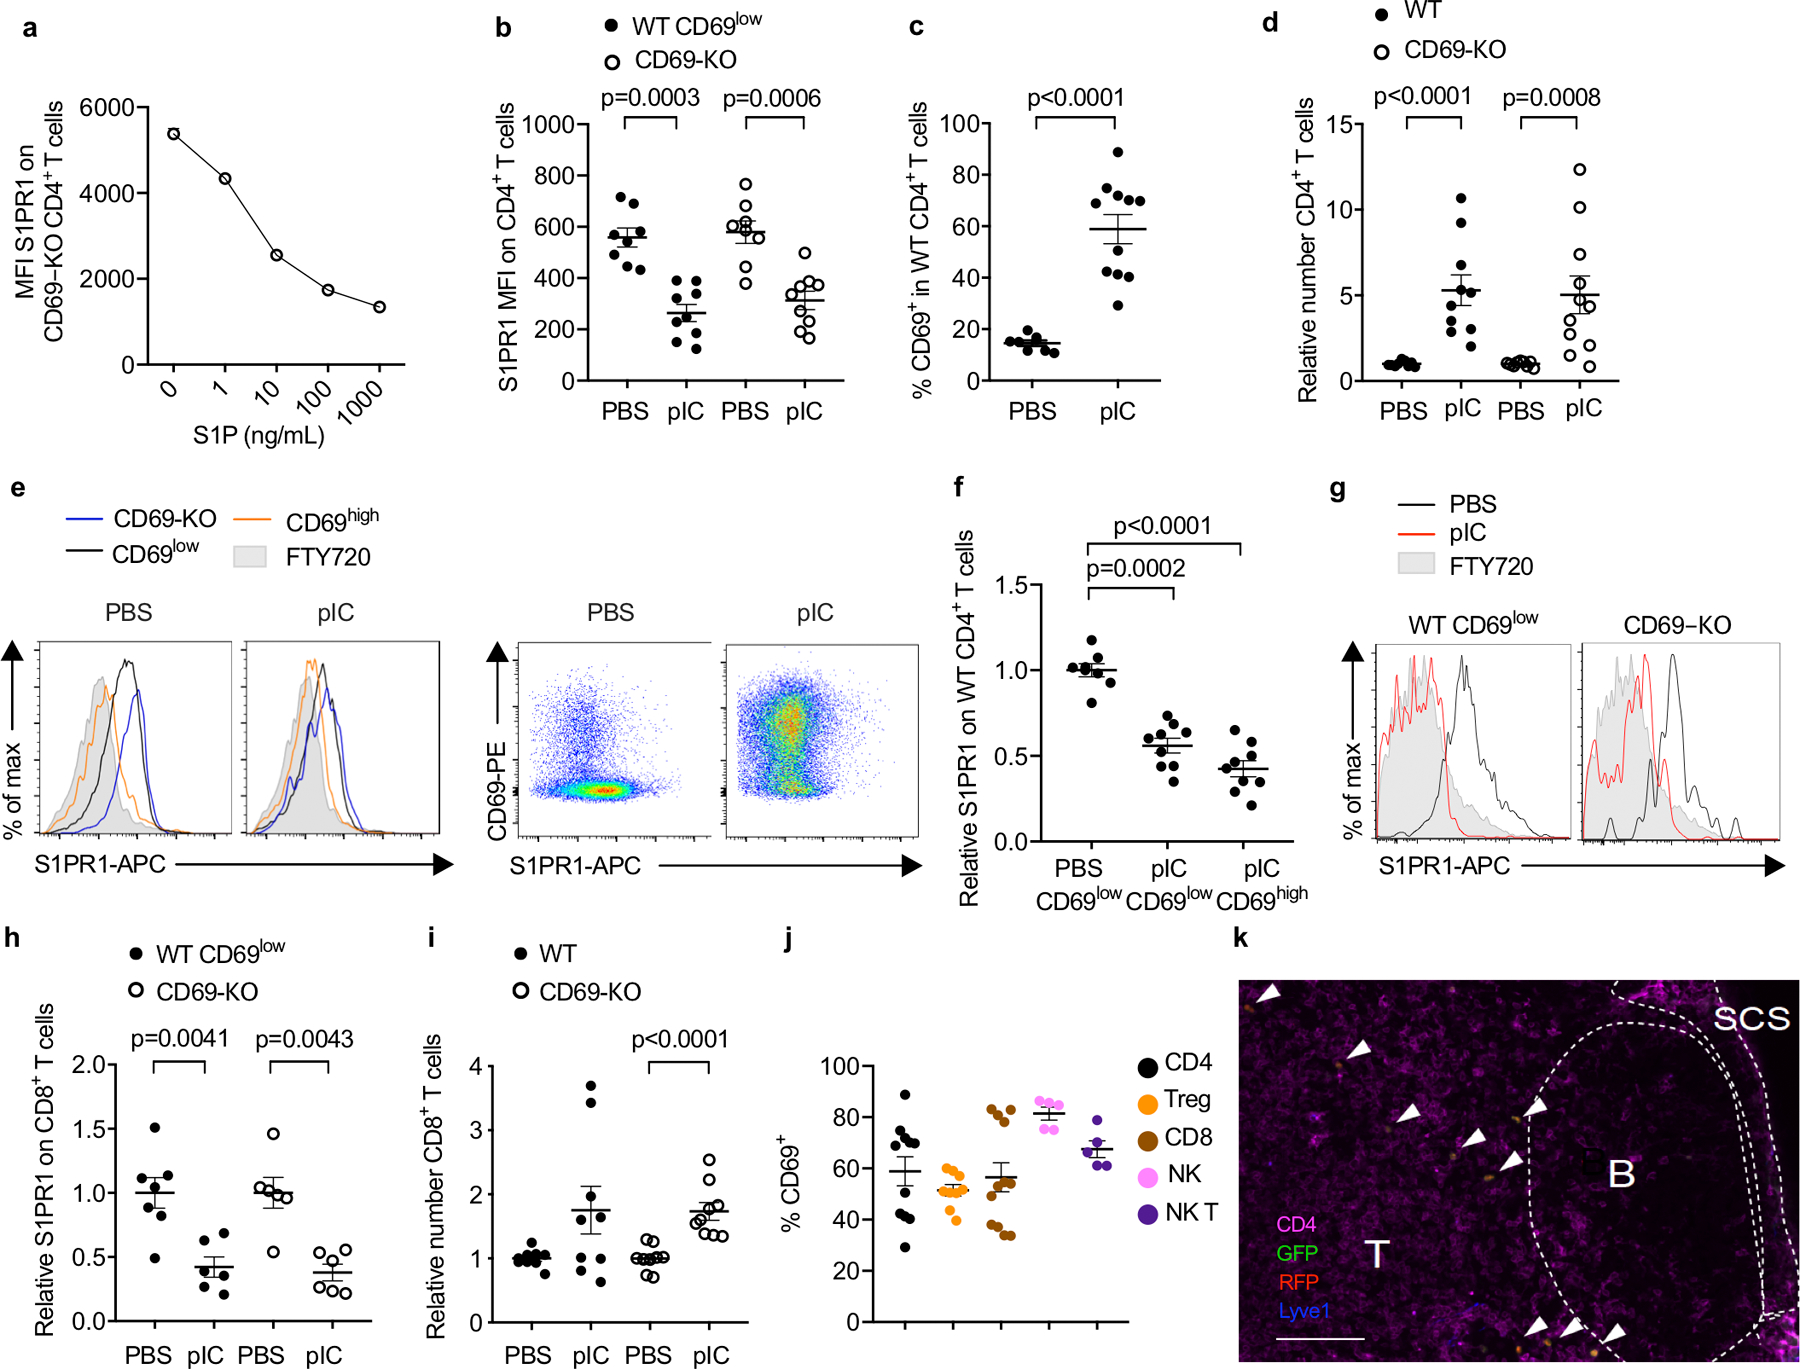
E.D. Fig. 1: S1P increases in the dLN after pIC injection.

(a) CD69-KO lymphocytes (from LN) were incubated ex vivo with the indicated concentrations of S1P for 16h, and surface S1PR1 on CD4+ T cells was measured by flow cytometry. Average of triplicates +/− SEM in 1 experiment. (b-i) Experiment design and animals as in Fig. 1a–c. Compilation of 4 experiments for all panels except (h), which compiles 3 experiments. (b) Absolute MFI of S1PR1 for the cells shown in Fig. 1c. PBS (n=8); pIC (n=9). (c) Percent CD69+ among endogenous (WT) CD4+ T cells in dLN. PBS (n=8); pIC (n=11). (d) Relative number of the indicated CD4+ T cells in dLN. The number of endogenous CD4+ cells in the dLN of each mouse was divided by the mean number of endogenous CD4+ cells in the PBS-treated group; the number of transferred CD69-KO CD4+ cells in each mouse was similarly divided by the mean number of CD69-KO CD4+ transferred cells in the PBS-treated group. PBS (n=9); pIC (n=11). (e) (left) Representative histograms of S1PR1 on transferred CD69-KO, endogenous CD69low, and endogenous CD69high CD4 T cells in PBS- or pIC-treated mice. (right) Representative dot plots of CD69 vs S1PR1 on endogenous CD4 T cells in PBS- or pIC-treated mice. Representative of the data compiled in (f). (f) The S1PR1 MFI of endogenous CD69low or endogenous CD69high CD4+ cells in each mouse divided by the mean S1PR1 MFI of endogenous CD69low CD4+ cells in the PBS-treated group. PBS (n=8); pIC (n=9). (g) Representative histograms of surface S1PR1 on endogenous (WT) CD69low or transferred CD69-KO CD8+ T cells in the dLN. FTY720-treated mouse served as a negative control. (h) The S1PR1 MFI of the endogenous CD69low CD8+ cells in each mouse was divided by the mean S1PR1 MFI of the endogenous CD69low CD8+ cells in the PBS-treated group; the S1PR1 mean fluorescence intensity (MFI) of the transferred CD69-KO CD8+ cells in each mouse was similarly divided by the mean MFI of the transferred CD69-KO CD8+ cells in the PBS-treated group. PBS (n=7); pIC (n=6). (i) Relative number of the indicated CD8+ T cells in the dLN. PBS (n=9), pIC (n=9). (j) Experiment design as in Fig. 1a. Percent CD69+ among total CD4+ (n=11), Treg (CD4+ Foxp3+) (n=9), CD8+ (n=12), NK (NK1.1+CD3−) (n=5), and NKT (NK1.1+CD3+) (n=5) cells in the dLN of pIC-treated mice. Compilation of 4 experiments. (k) CD69-KO Sensor+ T cells were transferred i.v. into WT recipients. 24h later, mice were treated s.c. with PBS or pIC. 14h later, dLN were analyzed by confocal microscopy. Representative section, showing T zone, B follicles, and subcapsular sinus (SCS). Arrows indicate transferred cells. Scale bar, 100 µm. Representative of 5 experiments, PBS n=7, pIC n=8. Data are presented as mean values +/− SEM. Mann-Whitney two-tailed t test.
