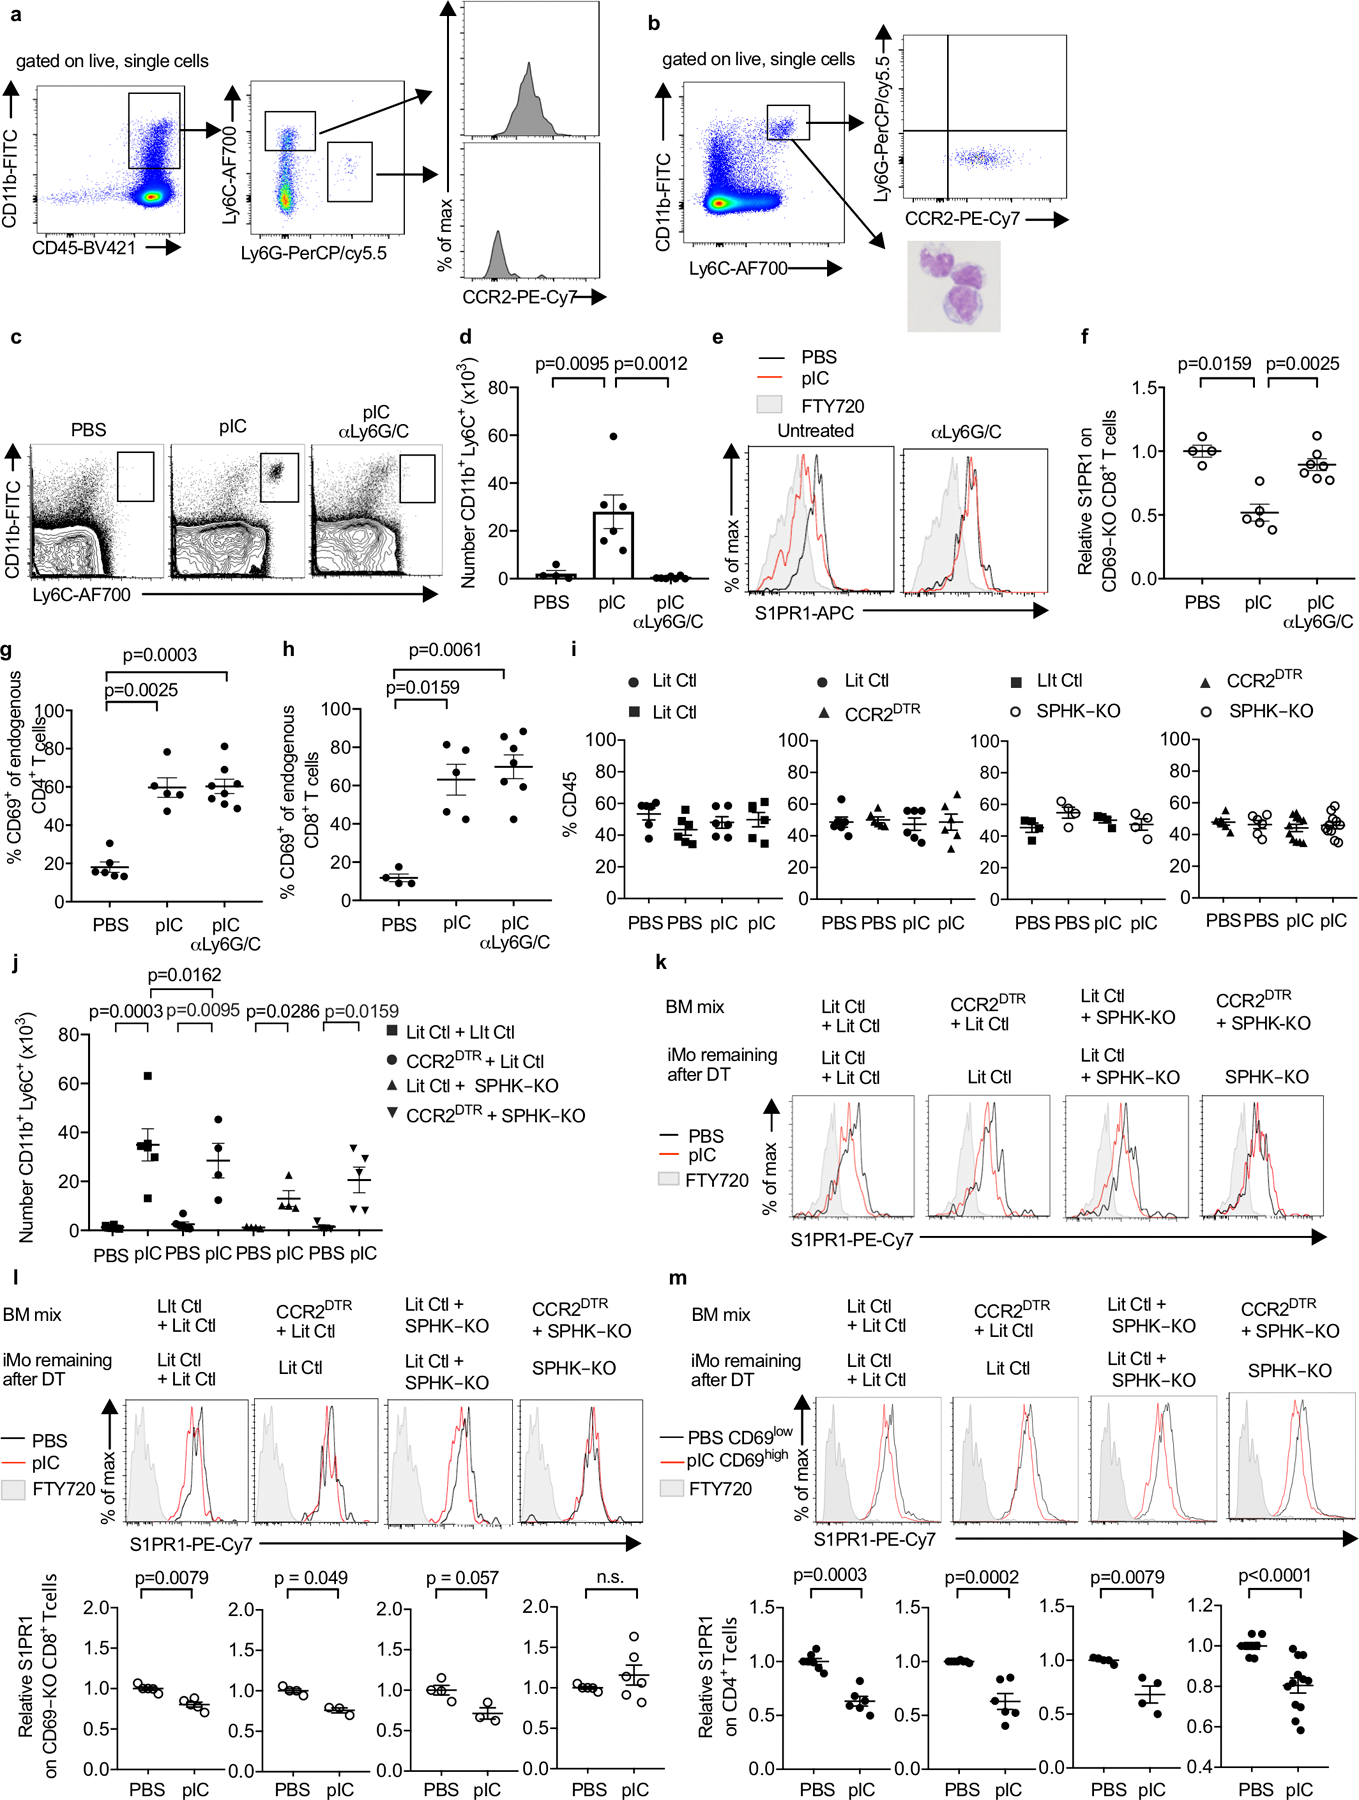
E.D. Fig. 3: CD11b+LY6ChiCCR2+ cells contribute to increased LN S1P.

(a) Phenotype of cells infiltrating the dLN in WT mice 14h after pIC injection. Representative of 5 experiments. (b) Phenotype of sorted iMo. Left panel, sort gate (Ly6ChiCD11bhi). Right top panel, staining of sorted cells for Ly6G and CCR2. Representative of 3 experiments. Right bottom panel, Wright-Giemsa stain of sorted cells. Representative of 2 experiments. (c-h) C57BL/6 mice were injected i.p. with a depleting anti-Ly6C/G antibody on d0 and d2, or left untreated. On d1, the mice received CD69-KO CD45.1+ lymphocytes i.v. On d2, the mice were treated s.c. with PBS or pIC, and dLN were analyzed 14h later. Compilation of 3 experiments. (c) Representative flow cytometry plots. (d) Number of iMo in the dLN (PBS n=4, pIC n=6, pIC anti-Ly6C/G n=7). (e) S1PR1 on CD69-KO CD8+ T cells. (f) Compilation. (PBS n=4, pIC n=5, pIC anti-Ly6C/G n=7). (g) Percent CD4+ T cells that were CD69+ (PBS n=6, pIC n=5, pIC anti-Ly6C/G n=8). (h) Percent CD8+ T cells that were CD69+ (PBS n=4, pIC n=5, pIC anti-Ly6C/G n=7). (i-m) Lethally irradiated C57BL/6 mice were reconstituted with a 1:1 mix of the indicated BM, and analyzed 12–16 weeks later. On d0 and d2, the chimeras were treated with DT. On d1, the chimeras received CD69-KO CD45.1+ lymphocytes i.v. On d2, the chimeras were injected s.c. with PBS or pIC, and 14h later the dLN were analyzed. (i) Percent of total CD45+ cells contributed by each genotype in dLN of the indicated chimeras Compilation of 5 experiments. LitCtl:LitCtl (PBS n=6; pIC n=6); CCR2DTR:LitCtl (PBS n=6; pIC n=6); LitCtl:SPHK-KO (PBS n=4; pIC n=4); CCR2DTR:SPHK-KO (PBS n=6 pIC n=11). (j) Number of iMo in the dLN of the indicated chimeras. Compilation of 3 experiments. LitCtl:LitCtl (PBS n=6, pIC n=6); CCR2DTR:LitCtl (PBS n=6, pIC n=4); LitCtl:SPHK-KO (PBS n=4, pIC n=4); CCR2DTR:SPHK-KO (PBS n=6, pIC n=5). (k) Representative histograms of S1PR1 expression on CD69-KO CD4+ T cells in the indicated chimeras. (l) Representative histograms of S1PR1 expression on CD69-KO CD8+ T cells in the indicated chimeras (top) and compilation (bottom) of S1PR1 expression on CD69-KO CD8+ T cells in the indicated chimeras. Compilation of 3 experiments. LitCtl:LitCtl (PBS n=5, pIC n=5); CCR2DTR:LitCtl (PBS n=4, pIC n=3); LitCtl:SPHK-KO (PBS n=4, pIC n=3); CCR2DTR:SPHK-KO (PBS n=5, pIC n=6). (m) Representative histograms (top) and compilation (bottom) of S1PR1 expression on endogenous CD4 T cells in the indicated chimeras. For the compilation, the S1PR1 MFI of the CD69low CD4+ T cells in each mouse in the PBS-treated group was divided by the mean S1PR1 MFI of the CD69low CD4+ T cells in the PBS-treated group; the S1PR1 MFI of the CD69high CD4+ T cells in each mouse of the pIC-treated group was similarly divided by the mean MFI of the CD69low CD4+ T cells in the PBS-treated group. LitCtl:LitCtl (PBS n=7, pIC n=6); CCR2DTR:LitCtl (PBS n=6, pIC n=6); LitCtl:SPHK-KO (PBS n=4, pIC n=4); CCR2DTR:SPHK-KO (PBS n=8, pIC n=12). Compilation of 5 experiments. Bars represent mean +/− s.e.m. Mann-Whitney two-tailed t test.
