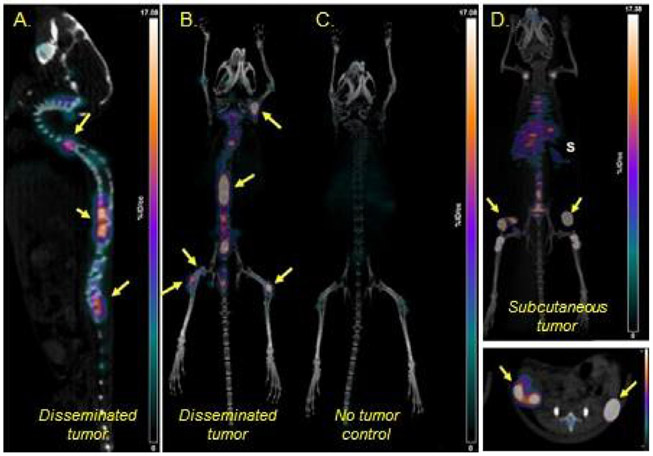
Figure 1.
(A-D) Representative maximum-intensity-projection (MIP) [89Zr]Zr-DFO-daratumumab PET/CT images of disseminated MM.1S-CG tumor–bearing mouse, nontumor control mouse and subcutaneous MM.1S-CG tumor–bearing SCID mice 7 days post injection of radiopharmaceutical. S = spleen; Yellow Arrows = tumors. Scale: 0-17 %ID/g. DFO, Desferoxamine, chelator for [89Zr]. (part of figure reprinted from JNM 2018, (ref. 3)).

