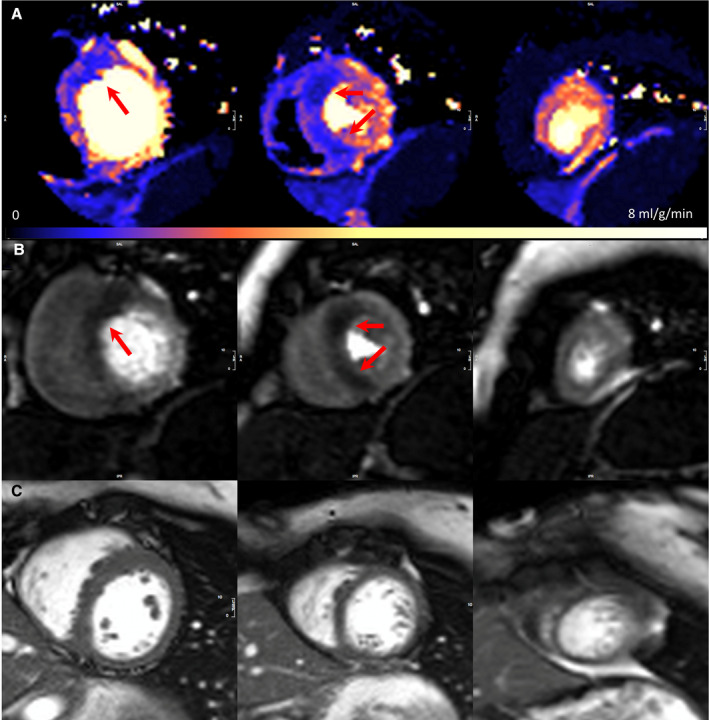
Figure 1. Septal perfusion defects in genotype‐positive; left ventricular hypertrophy‐negative.

A, Adenosine stress perfusion maps in the 3 short‐axis slices, where each pixel encodes myocardial blood flow as per the color scale. Perfusion defect in the mid‐basal septum. B, Raw stress perfusion imaging. C, Corresponding short‐axis cine (maximum left ventricular wall thickness was 11.7 mm) (perfusion scans are acquired partly in systole). Arrows demonstrate the perfusion defects. SAX indicates short axis.
