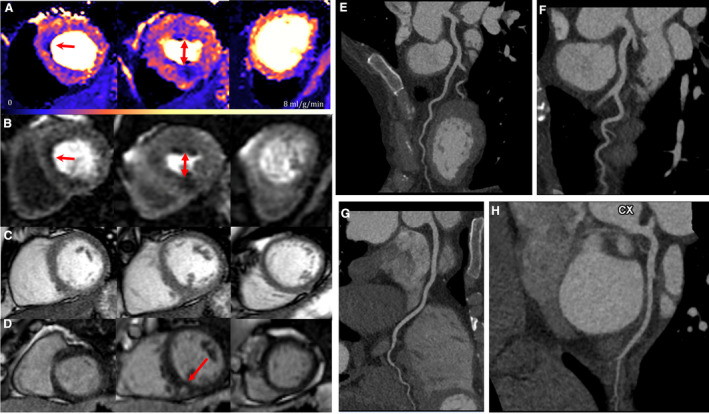
Figure 2. Basal septal and mid‐right ventricular insertion point significant perfusion defects in genotype‐positive; left ventricular hypertrophy‐negative with minor inferior right ventricular insertion point late gadolinium enhancement and normal computed tomography coronary angiogram.

A second example, with the perfusion defects in a slightly different location to that of Figure 1. A, Adenosine stress perfusion maps in the 3 short‐axis slices. B, Corresponding raw stress perfusion images and (C) Corresponding short‐axis cine (maximum left ventricular wall thickness was 9.8mm). D, Corresponding short‐axis phase‐sensitive inversion recovery late gadolinium enhancement imaging. E, Computed tomography coronary angiogram image of left anterior descending artery (unobstructed). F, Computed tomography coronary angiogram image of left anterior descending artery (unobstructed). G, Computed tomography coronary angiogram image of right coronary artery (unobstructed). H, Computerized tomography coronary angiogram image of left circumflex coronary artery (unobstructed). Arrows indicate perfusion defects. CTCA indicates computed tomography coronary angiogram; LAD, left anterior descending artery; LCx, left circumflex coronary artery; LGE, late gadolinium enhancement; PSIR, phase‐sensitive inversion recovery; RCA, right coronary artery; and SAX, short axis.
