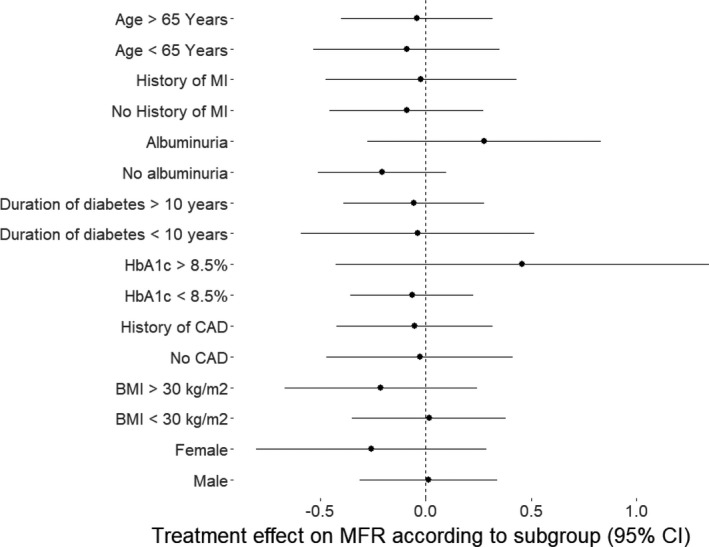
Figure 3. Change in MFR from baseline to 13 weeks according to the pre‐defined subgroups. Dots indicate means, bars indicate 95% CI.

CAD indicates coronary artery disease; MFR, myocardial flow reserve; and MI, myocardial infarction.

CAD indicates coronary artery disease; MFR, myocardial flow reserve; and MI, myocardial infarction.