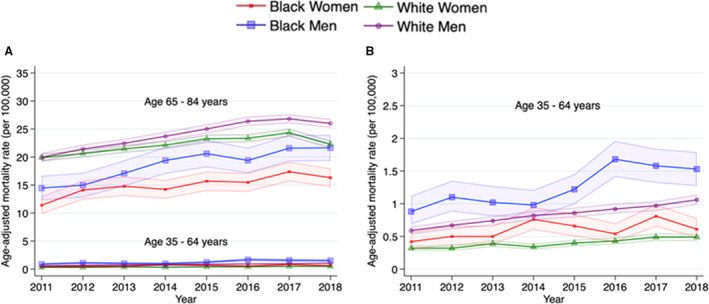
Figure 5. Trends in age‐adjusted mortality rates of deaths attributable to atrial fibrillation as the underlying cause of death, stratified by race‐sex and age groups, between 2011 and 2018.

A, Trends stratified by race‐sex across 2 age groups. B, Magnified figure for younger age subgroup. Mortality rates per 100 000 with 95% CI (dotted line) are shown by race and sex.
