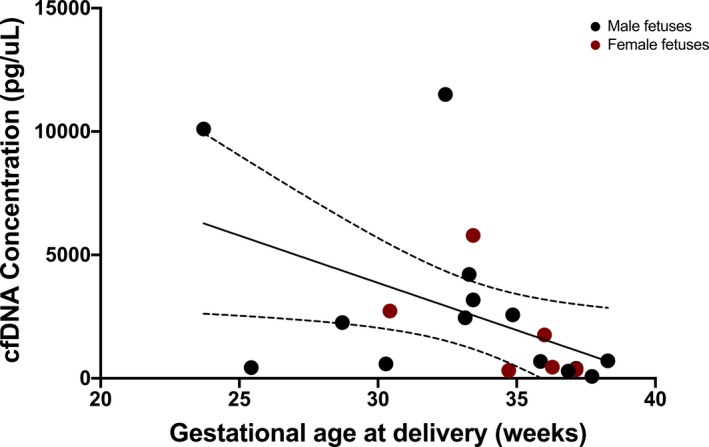
Figure 3. Correlation of total cell‐free DNA (cfDNA) concentration and gestational age at delivery in preeclampsia.

Correlation between total cfDNA concentration and gestational age at delivery in the preeclampsia cohort (r s=−0.57, P=0.01). The dotted lines represent the 95% CI.
