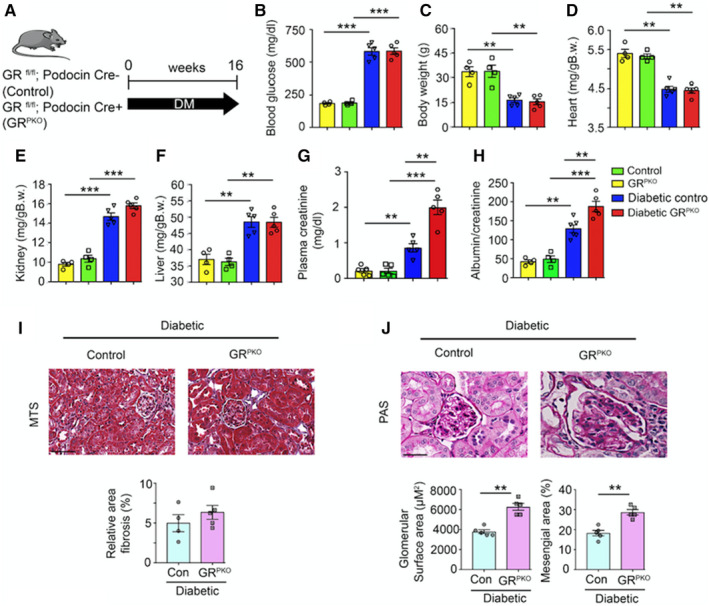
Figure 1. Physiological characteristics of nondiabetic and diabetic podocyte‐specific glucocorticoid receptor knockout (GRPKO) mice.

A, Schematic diagram, showing induction of diabetes mellitus in GRfl/fl; Podocin Cre‐ (control), and GRfl/fl; Podocin Cre+ (GRPKO) mice. Five doses of streptozotocin 50 mg/kg per day intraperitoneally were injected to induce fibrosis. After 16 weeks, mice were sacrificed. Physiological parameters: B, blood glucose; C, body weight; D, heart weight/body weight; E, kidney weight/body weight; F, liver weight/body weight; G, plasma creatinine, and H, albumin‐to‐creatinine ratio were measured. n=4 to 6 mice/group. I, Masson‐Trichrome stain (MTS); J, Periodic acid‐Schiff (PAS) staining in kidneys of diabetic control and GRPKO mice were analyzed. Representative images are shown. Relative area fibrosis (%), glomerular surface area (μm2), and mesangial area (%) were measured using ImageJ. n=4 to 5 mice/group. Scale bar: 50 μm in each panel. *P<0.05, **P<0.01, ***P<0.001. Data are mean±SEM. Two‐way ANOVA was used to analyze B through H and nonparametric Mann‐Whitney U test was used to analyze I and J. DM indicates diabetes mellitus.
