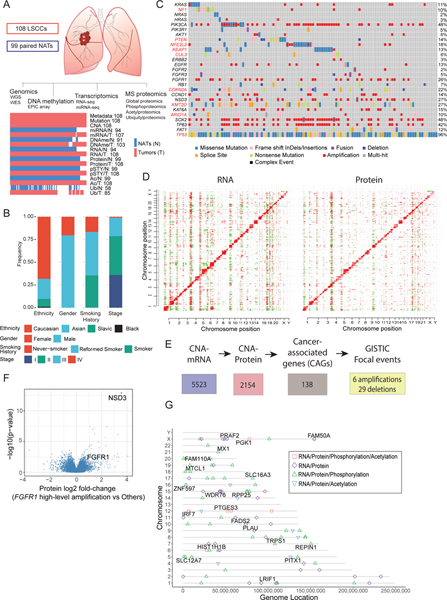
Figure 1: Proteogenomic Landscape of LSCC.
A. Schematic showing the number of tumors and NATs profiled and the various data types generated in this study. The lower panel represents data completeness. WGS: Whole Genome Sequencing, WES: Whole Exome Sequencing. CNA: copy number alteration. DNAme: DNA methylation. pSTY: phosphoproteome. Ac: acetylproteome. Ub: ubiquitylproteome.
B. Stacked histograms indicating the distribution of patient phenotypes. Smoking History reflects self-report.
C. Co-occuring mutation plot indicating cancer-relevant genes. MutSig-based significantly mutated genes (SMGs, q-value < 0.1) in this dataset are highlighted in red font.
D. Heatmaps showing correlation between copy number alterations (CNA) and RNA (left) or proteomics (right). Red and green events represent significant (FDR <0.01) positive and negative correlations, respectively.
E. Flow chart for identification of cancer-associated genes (CAGs) that showed GISTIC-based focal amplification or deletion (q<0.25) and cis-effects in both mRNA and protein (FDR<0.05).
F. Differential protein expression (Log2 fold-change (FC)) in tumors with and without high-level amplification of the FGFR1 gene (GISTIC thresholded value =2).
G. Genes whose DNA methylation was significantly associated with cascading cis regulation of their cognate mRNA expression, protein level, phosphopeptide and acetylpeptide abundance. Shapes indicate the cis-effects across the indicated datasets. Named genes also showed differential expression between tumors and NATs.

