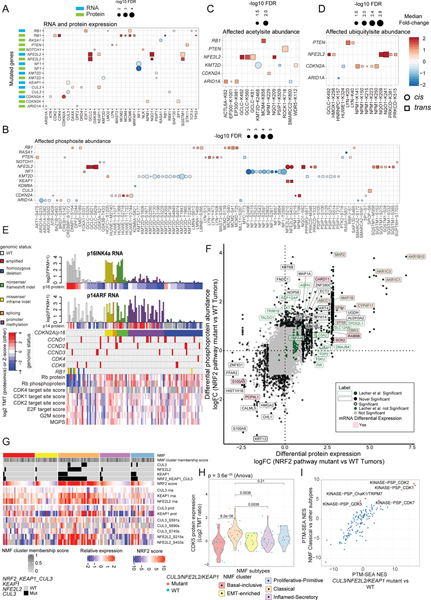
Figure 3: Impact of Somatic Mutations on Proteogenomic Features.
A. Significant (Wilcoxon FDR<0.05) cis- (circles) and trans-effects (squares) of selected mutations (x axis) on the expression of cancer-associated gene products, with mRNA in blue and proteins in green.
B. Similar to panel A but showing phosphosites.
C. Similar to panel A but showing acetylsites.
D. Similar to panel A but showing ubiquitylsites.
E. CNA data for CDKN2A and RB1 was used to classify tumors as having homozygous deletions or three classes of loss of heterozygosity mutations: nonsense/frameshift indel, missense/inframe indel, and splicing (see Table S4). CDKN2A genetic and hypermethylation annotations were based on the effect of the aberration on the p16INK4a (p16) gene product, but the effects of these CDKN2A/p16 aberrations on both major isoforms (p16INK4a and p14ARF (p14)) at the RNA (barplot) and protein (heatmap directly below barplot) levels are shown. Samples with amplification of CCND1–3, CDK4, and CDK6 were assessed by GISTIC (threshold = 2), and the genomic status, protein, and phosphoprotein levels for RB1 are included. Also shown are RNA-based scores for the cell cycle (MGPS, the mean of cell cycle genes and E2F target and G2M checkpoint gene set scores derived from ssGSEA of Hallmark gene sets) and phosphosite-based CDK kinase activity scores for CDKs 1, 2, and 4 derived from single sample post translational modifications - signature enrichment analysis (ssPTM-SEA) of known kinase targets. Three tumors with copy number gain of CDKN2A are not included.
F. Correlation between differential regulation of protein abundance (Log2 Fold-change (FC)) versus phosphoprotein log2 FC in tumors with NRF2 pathway mutation (one or two mutations in KEAP1, CUL3, or NFE2L2) versus NRF2 WT tumors (no NRF2 pathway aberration).
G. NRF2 pathway score and RNA, protein and phosphoprotein expression of key NRF pathway members according to NMF subtype.
H. CDK5 protein expression (Log2 TMT ratio) by NMF subtype. P-values are from the Anova test.
I. PTM-SEA-derived normalized enrichment scores (NES) for pathways enriched in NRF2 pathway-mutated (Mutant) vs wild-type samples (WT) plotted against NES for pathways enriched in NMF Classical vs other subtypes. Significantly upregulated (FDR<0.05) PTM-SEA terms in the Classical subtype are indicated by red dots and labeled.

