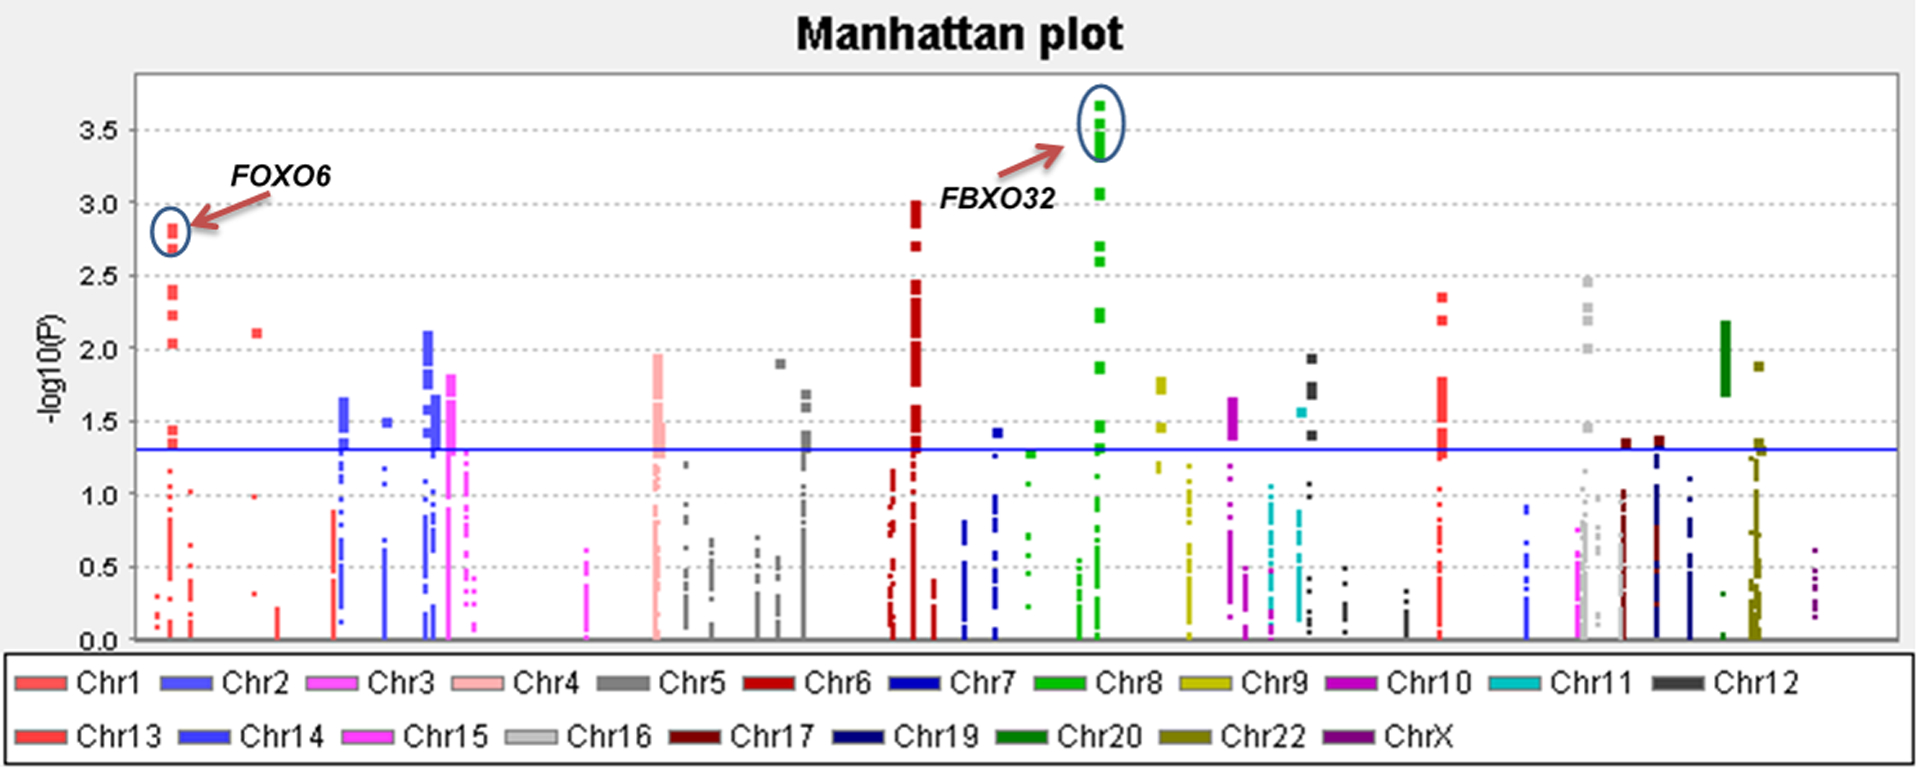
Figure 2. Manhattan plot of the 5,214 SNPs of FOXO pathway genes in the DRIVE study.

The x-axis represents each chromosome. The y-axis represents the P values for associations with breast cancer risk. The blue horizontal line indicates P value equal to 0.05. Abbreviations: DRIVE, Discovery, Biology, and Risk of Inherited Variants in Breast Cancer; FBXO32, F-box protein 32; FOXO, Forkhead box O; FOXO6, Forkhead box O6.
