
Figure 4. CNBr mapping of [125I]MFZ 2–24-labeled DAT mutants.
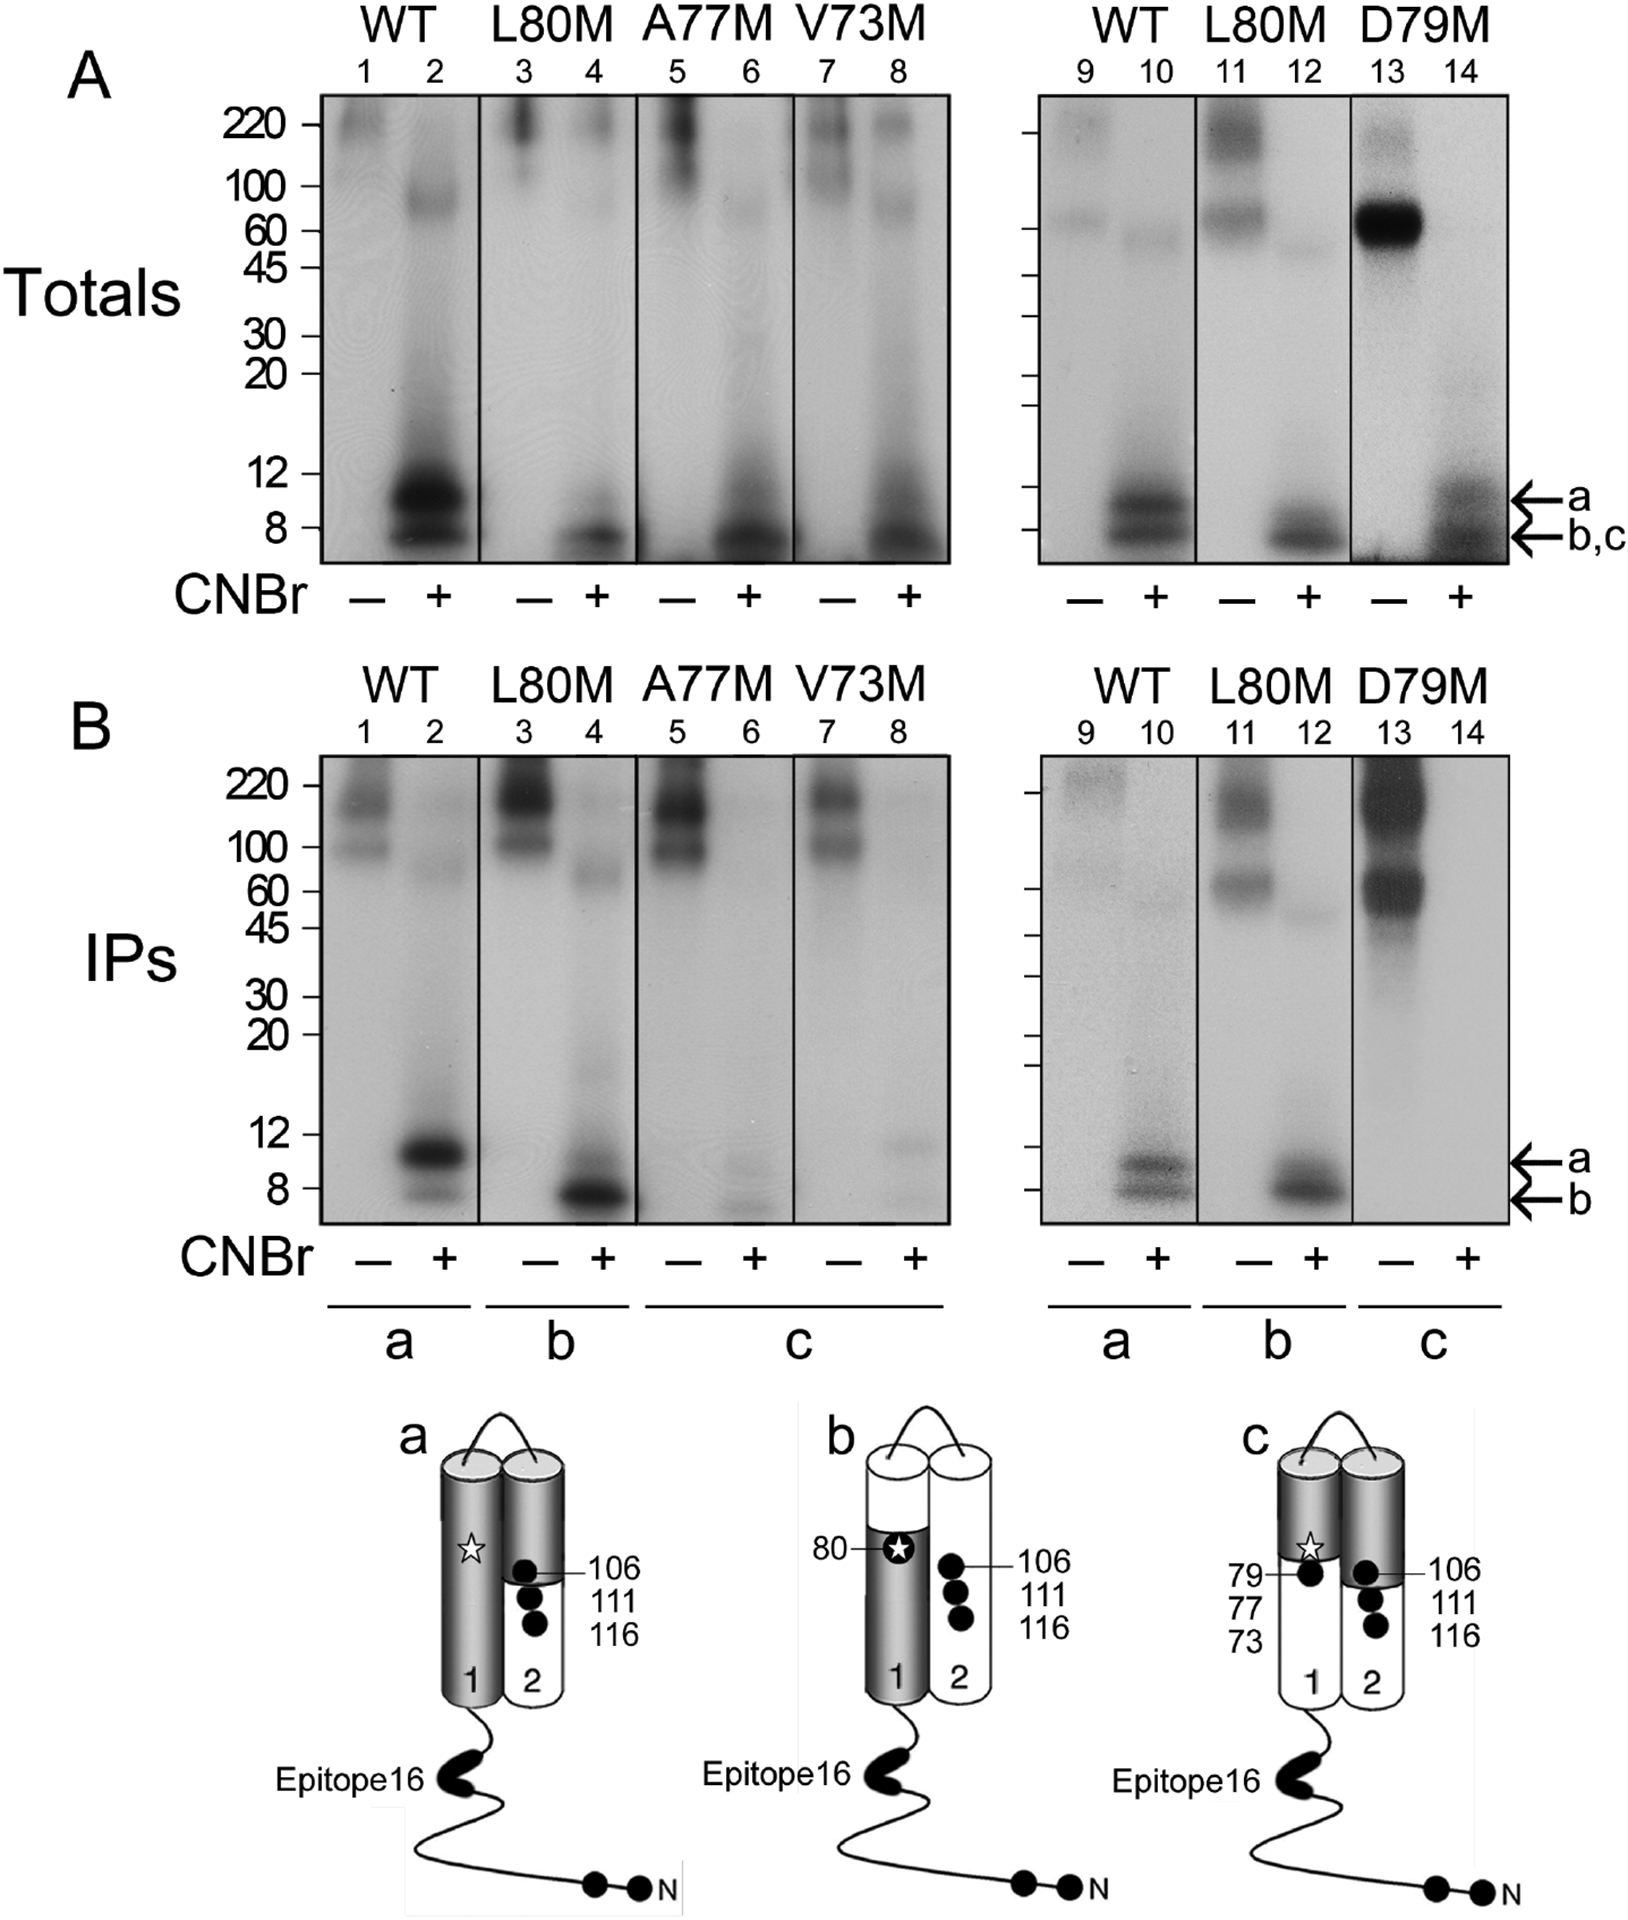
The indicated DAT forms were photolabeled with [125I]MFZ 2–24, gel purified, and equal amounts of radioactivity were treated with vehicle (odd numbered lanes) or CNBr (even numbered lanes). Aliquots of each sample were analyzed directly by SDS/PAGE-autoradiography to visualize the total pattern of CNBr fragments (A), or were immunoprecipitated with mAb 16 prior to SDS/PAGE-autoradiography (B). Left and right panels show independent experiments, and molecular mass markers shown on left gels are indicated by tic marks on right gels. Arrow a indicates migration of ~12 kDa CNBr fragment that extends from the Met-1/11 to Met106/111/116 and arrows b and c indicate ~3–8 kDa fragments produced by cleavage of exogenous TM1 Mets. Schematic diagrams show the cytosolic N-terminus, TMs 1 and 2, positions of endogenous and exogenous Met residues (filled circles), epitope for mAb 16 (bold line), adduction site of [125I]MFZ 2–24 (star), and origin of photolabeled CNBr fragments in primary sequence (grey shading).