
Figure 5. SCAM protection analysis of S1 and S2 binding pockets.
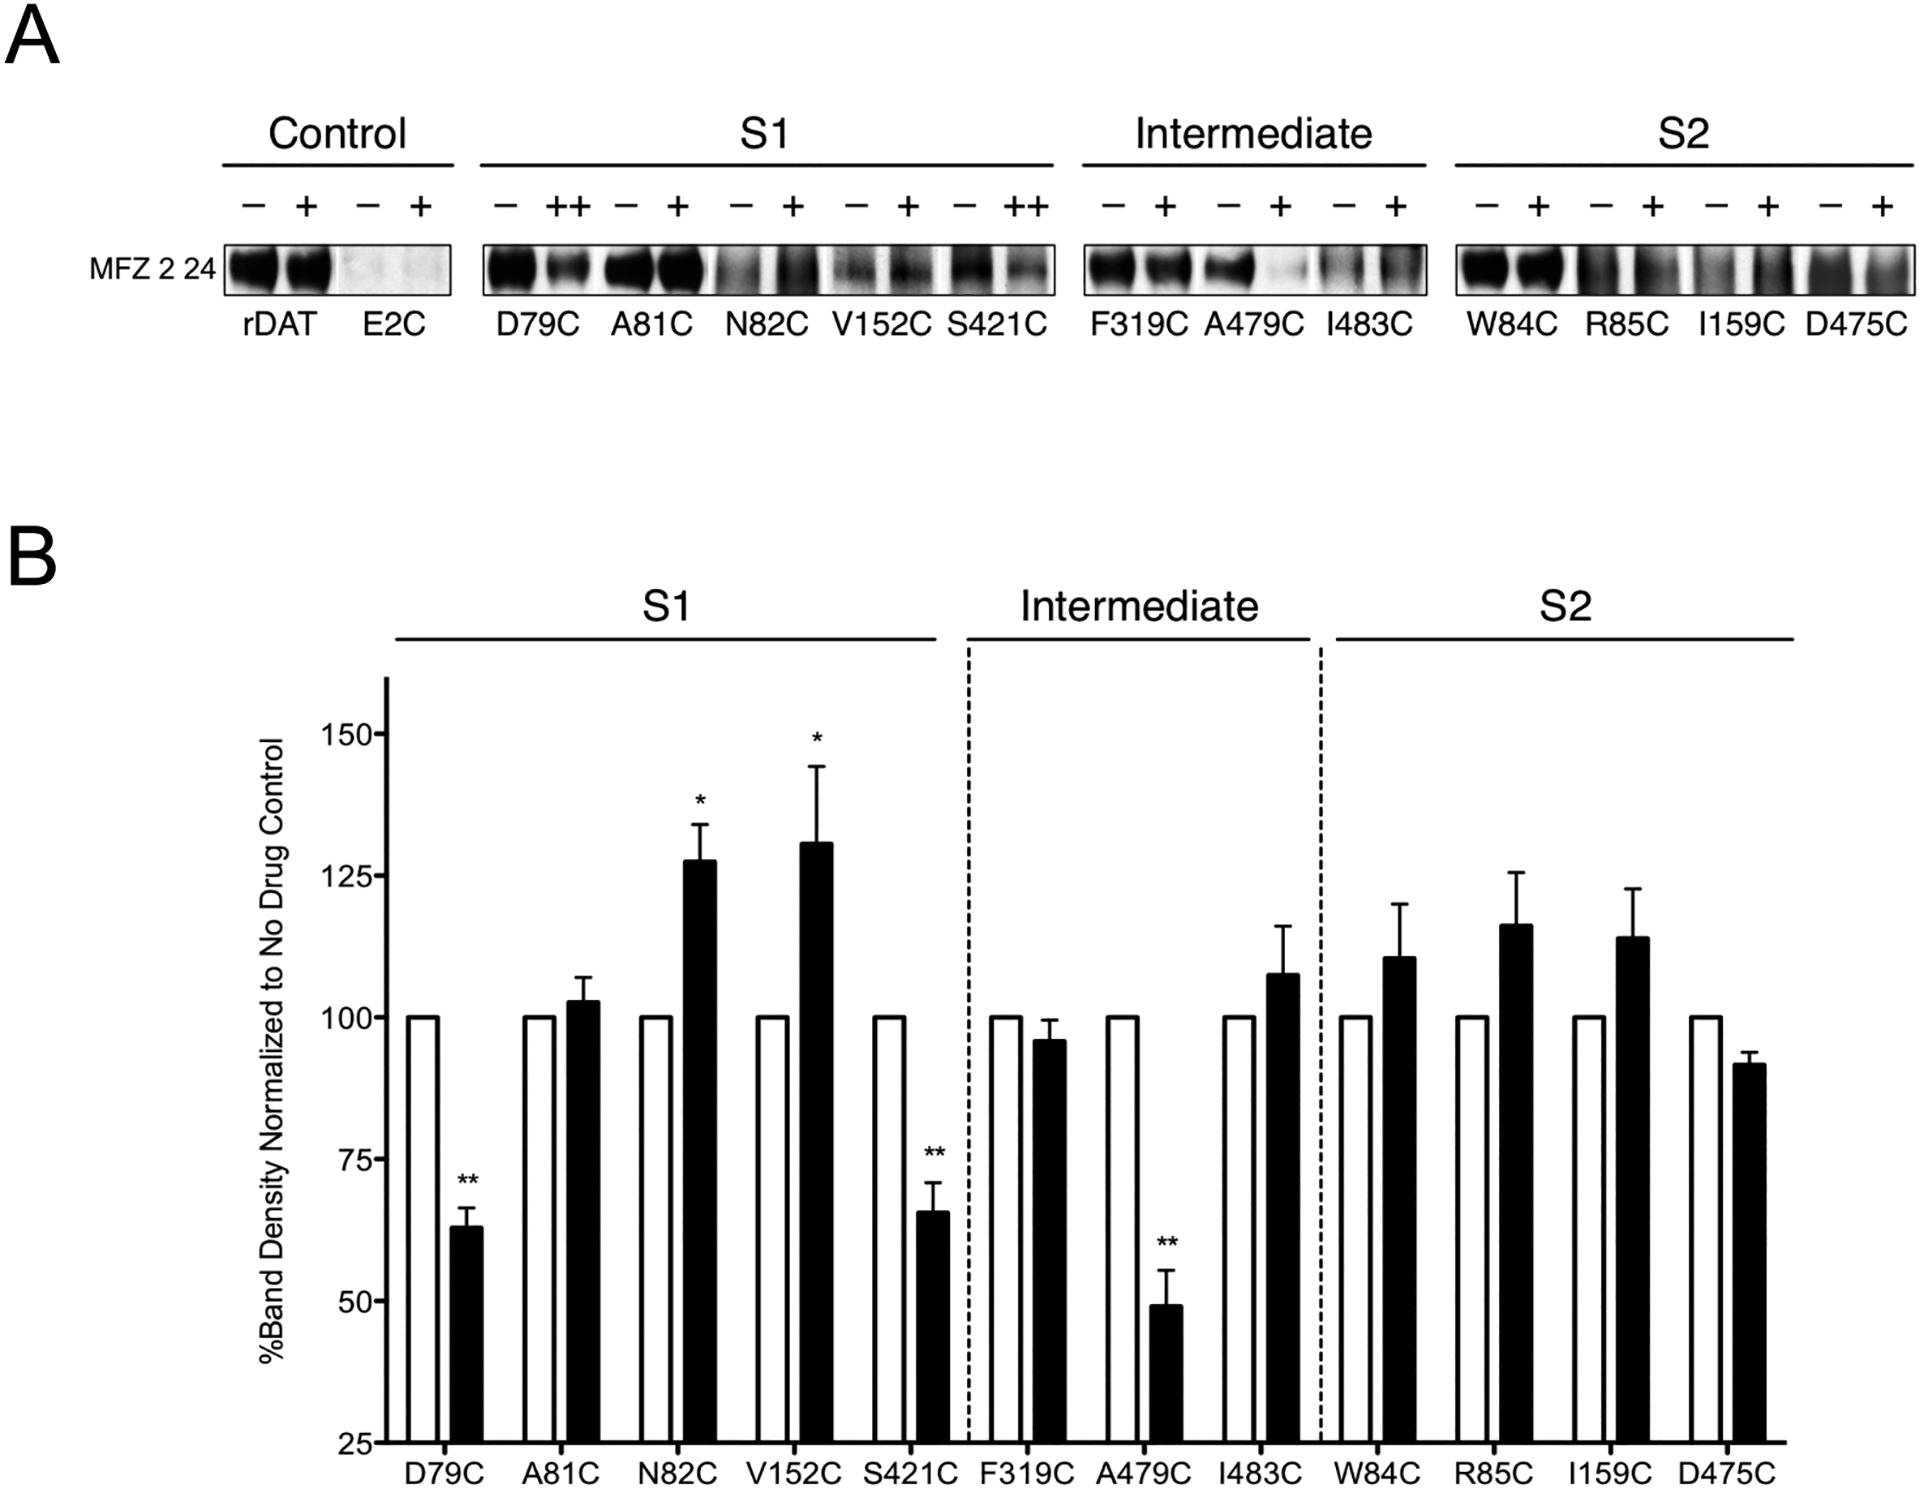
(A) Immunoblots of the surface pool of DAT Cys mutants in the rDAT E2C background purified with MTSEA-biotin in the absence (−) or presence of MFZ 2–24 (+, 10 μM; ++, 50 μM). (B) Quantification of DAT bands in A and total DAT expression (data not shown) were determined using ImageJ (National Institutes of Health). Surface samples were normalized to total DAT then expressed as a percent of MFZ 2–24-treated samples (black bars) to the respective untreated samples (white bars). These data represent three or more independent experiments. Significant differences between treated and untreated samples were determined with a paired Student’s t-test *, p < 0.05; **, p < 0.01.