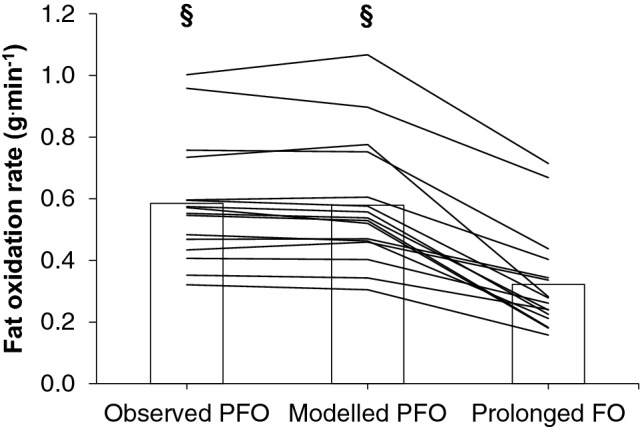
Fig. 1.

Comparison of peak fat oxidation during fasted incremental cycling estimated using observed and modelled values, and average fat oxidation during 2-h of fed-state cycling at 80% of the first ventilatory threshold. Bars indicate group mean and lines indicate individual responses. ‘§’ indicates P < 0.001 vs. average fat oxidation during 2-h of fed-state cycling at 80% of the first ventilatory threshold
