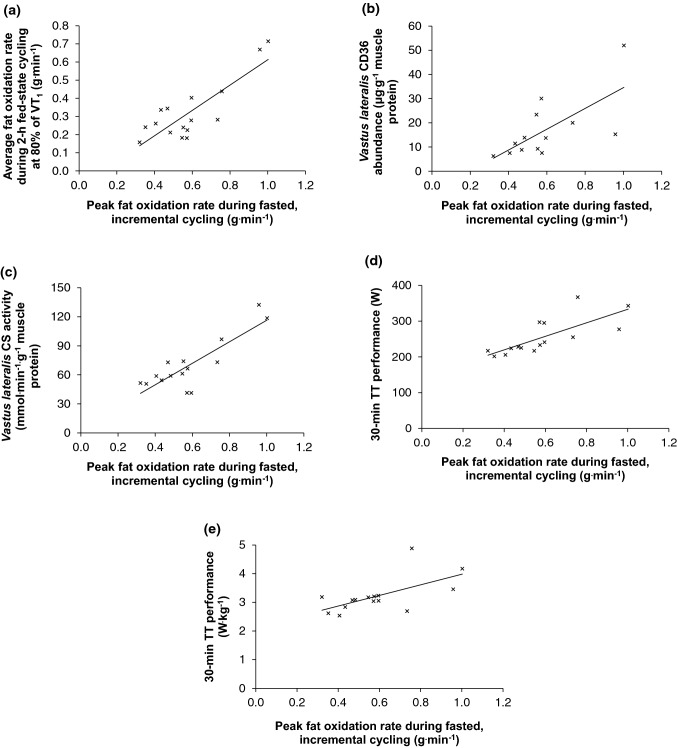
Fig. 2.
Relationships between peak fat oxidation during fasted, incremental cycling using observed values and a average fat oxidation during 2-h of fed-state cycling at 80% of the first ventilatory threshold (VT1), b vastus lateralis CD36 abundance, c vastus lateralis CS activity, d 30-min time-trial performance expressed in Watts, and e 30-min time-trial performance expressed in Watts per kilogram of body mass

