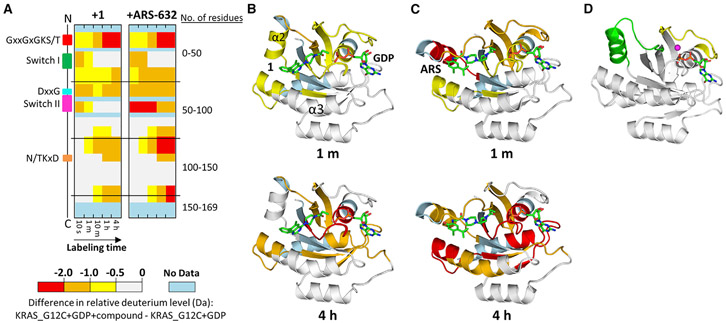
Figure 3. HDX MS Detects Changes in Switch II dynamics Induced by SIIP Binders.
(A) Differences in HDX are represented by relative deuterium levels of inactive protein covalently bound to compound minus that of inactive GDP-bound protein alone, scale shown at top. Two-dimensional representations of KRAS G12C are given in linear fashion from N terminus (top) to C terminus (bottom), and the locations of key structural elements are shown on the left. All deuterium-labeling time points are shown, increasing from left to right.
(B and C) Crystal structures of 1 (B) or ARS-853 (C) bound to KRAS G12C with HDX MS differences at labeling time point 1 min (upper panel) and 4 hr (lower panel) annotated using the color scheme from subpanel (A).
(D) KRAS G12C bound to GDP alone (PDB: 4LDJ) provided for comparison. In (D), switch I is shown in yellow and switch II in green; magnesium is represented as a magenta sphere.

