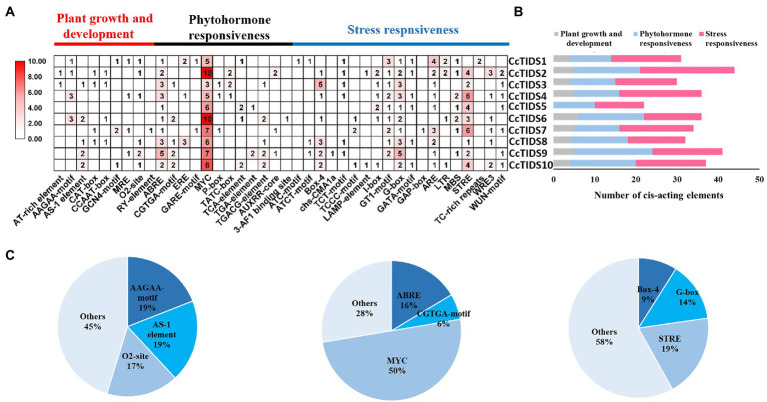
Figure 4.
(A) The number of cis-acting elements in each C. camphora (Cc)TIDS gene, indicated by the intensity of the red color and numbers in the grid. (B) Histograms indicating the number of cis-acting elements in each CcTIDS gene with functions in plant growth and development, phytohormone responsiveness, or stress responsiveness. (C) Pie charts showing the ratio of different cis-acting elements in each structural category.

