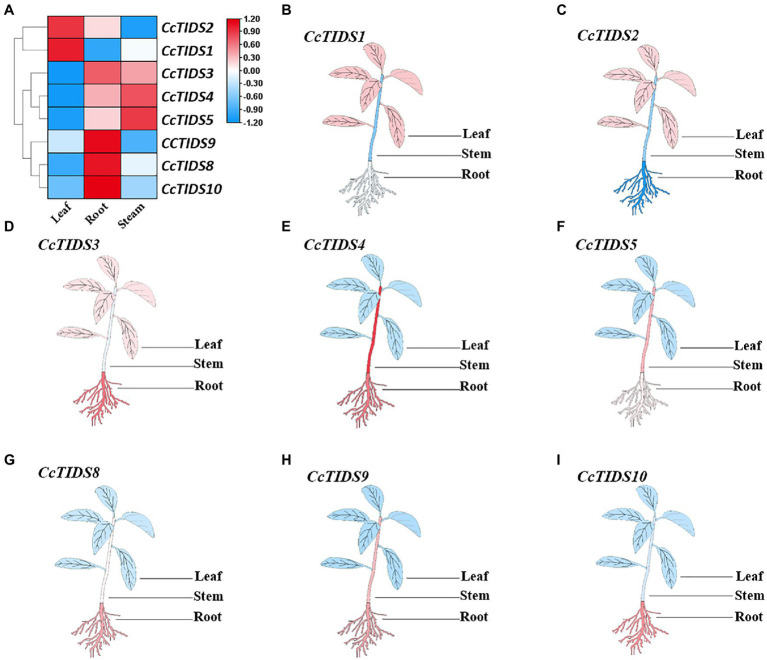
Figure 5.
Differential expression of C. camphora (Cc)TIDS genes in different tissues by transcriptome and quantitative real-time PCR (qRT-PCR). (A) FPKM value of the RNA sequencing data for each gene in leaf, root, and stem tissues. (B–I) Relative expression of each gene in the different plant tissues as calculated by qRT-PCR, with red and blue representing high and low expression levels, respectively.

