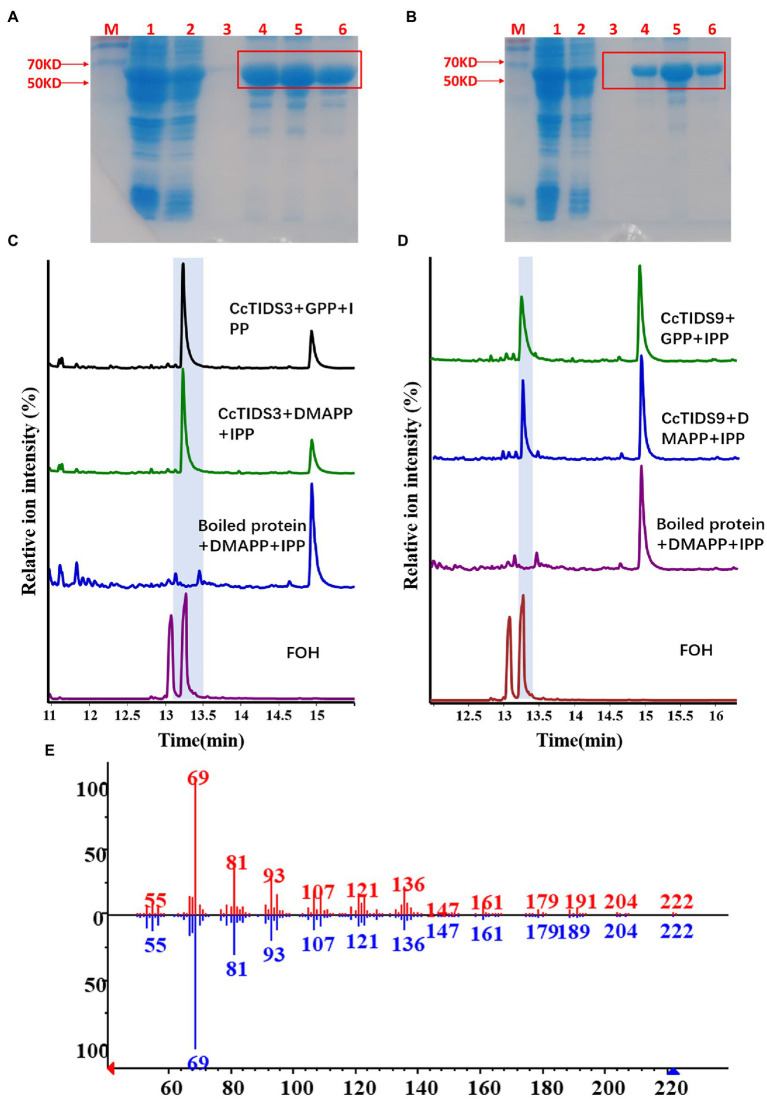
Figure 7.
Gas chromatography–mass spectrometry (GC–MS) profile showing in vitro reaction products of C. camphora trans-prenyltransferases CcTIDS3 and CcTIDS9, where different prenyldiphosphates were used as substrates. Expression and purification of (A) CcTIDS3 and (B) CcTIDS9 recombinant protein from Escherichia coli Rosetta (DE3) harboring pET32a(+)–CcTIDS3/CcTIDS9, where lane 1 shows the total protein after induction, 2 shows the soluble protein, and 3–6 shows the purified CcTIDS3 or CcTIDS9 recombinant protein from the first to the fourth collected tube. The GC–MS chromatogram of the reaction products generated by (C) CcTIDS3 and (D) CcTIDS9 and the acid hydrolysis products of farnesol (FOH) standards. (E) Mass spectra of farnesol standard (shown in red) and products in the NIST14/Wiley275 library (blue). GPP, geranyl diphosphate; DMAPP, dimethylallyl diphosphate; and IPP, isopentenyl diphosphate.

