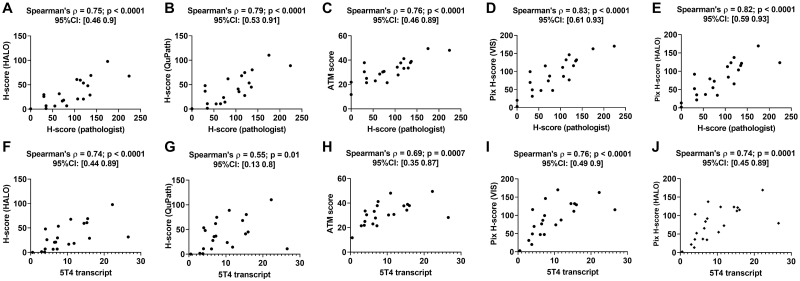
Fig 5. Performance of DIA endpoints obtained from 5T4 IHC images.
Panels A-E show plots of the different DIA endpoints as a function of the pathologist H-score, while panels F-J show the same as a function of 5T4 mRNA transcript for a cohort of 21 lung cancer resections. All panels show the Spearman’s correlation coefficient between the two quantities plotted in that panel along with the p-value and the 95% confidence interval.

