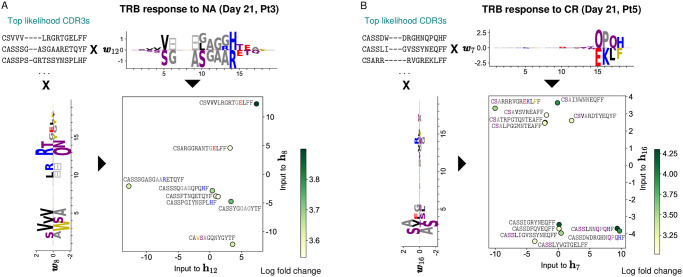
Fig 5. RBM-based dimensionality reduction of TRB response.
A: A lower-dimensional representation of RBM predicted TRB sequences of Pt3 responding to the NA antigen 21 days post-stimulation (same model as in Figs 1 and 2). We rank CDR3 sequences by likelihood and look at the top ones (8 clones). We select 2 sets of RBM weights displaying well-defined patterns of amino acid usage at the beginning and at the end of the CDR3 (respectively w8 and w12). The projection of top-likelihood clones onto these weights define the inputs to the corresponding hidden units (h8 and h12) in two dimensions. Depending on sequence patterns (see colored amino acids), responding clones have either a positive or negative projection onto the selected weights and end up occupying different portions of the space of inputs to hidden units. The color code (log base 10 of fold change) highlights that high model likelihood reflects high fold change. B: Same data representation by the RBM as in A, with the 12 top-likelihood clones for the Pt5 CR assay.

