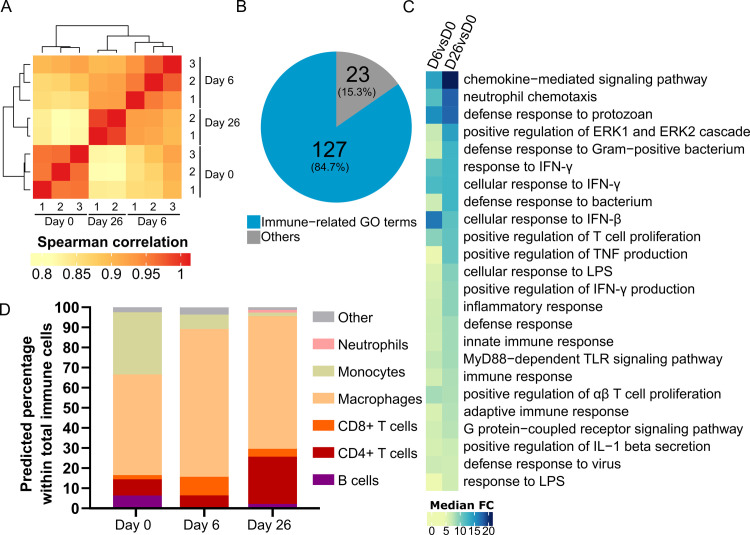
Fig 1. Transcriptome of T. brucei infected AT shows a strong immune response.
(A) Heat map of hierarchical clustering of Spearman correlations of Reads per kilobase per million mapped reads (RPKM) levels from non-infected (D0), n = 3 and infected AT at early (D6), n = 3 and late (D26), n = 2 time points. (B) Pie chart of most significant biological processes GO term families. (C) Heat map view of median fold change (FC) of genes associated to the top 20 Biological Process GO terms in day 6 and day 26 of infection versus non-infected AT (D6 vs D0 and D26 vs D0, respectively) (D) Prediction of immune cell distribution based on immuCC RNA-seq deconvolution.

