
Fig. 1.
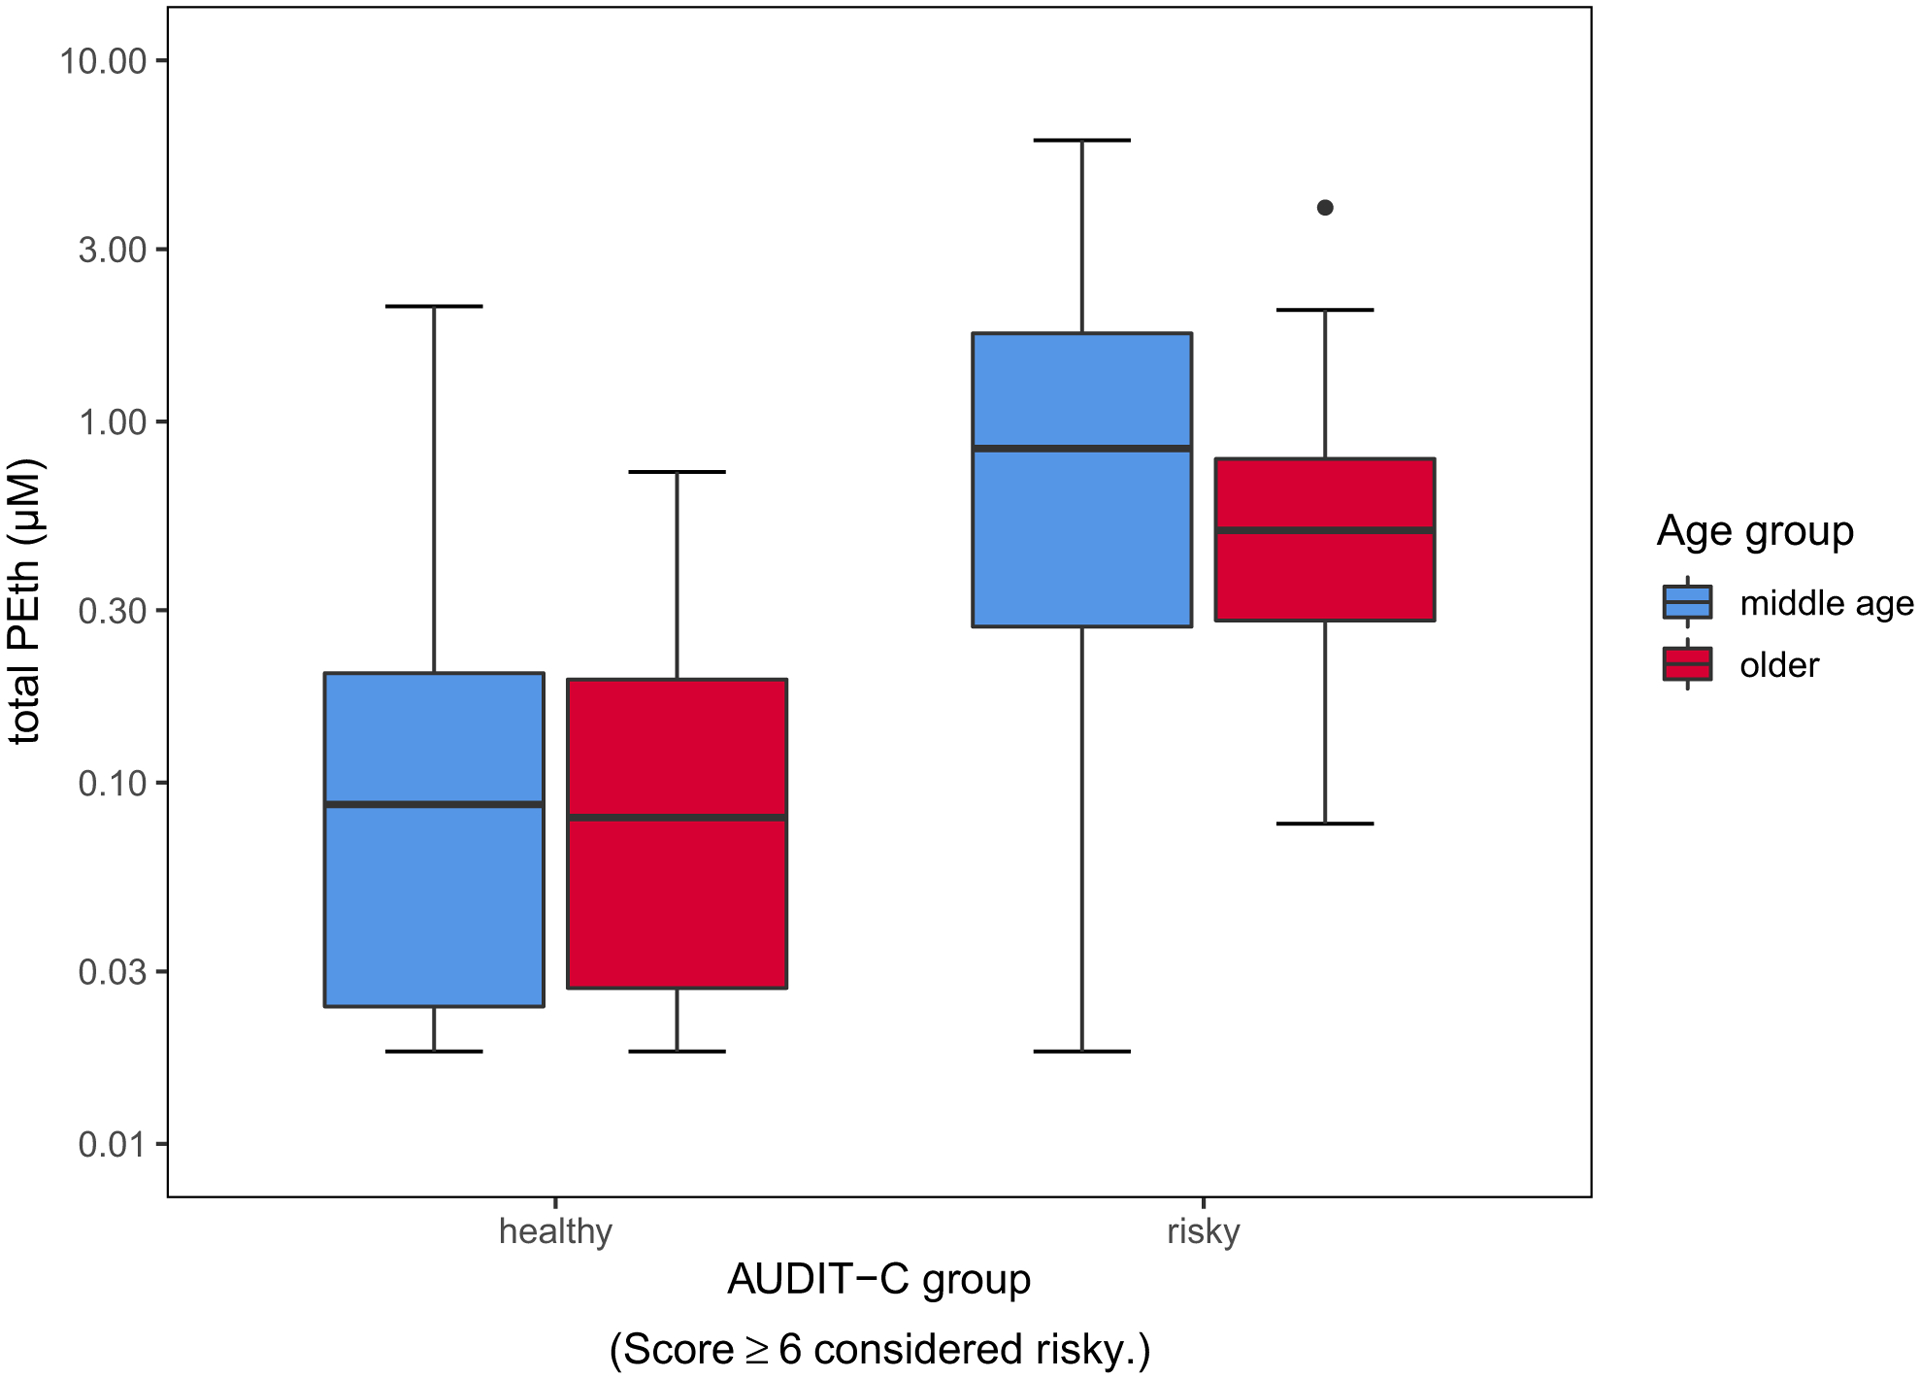
Boxplots of mean (line inside boxes) and standard deviations (vertical top and bottom of boxes) total blood PEth for middle-age (blue) and older adults (red) with healthy versus risky alcohol consumption as defined by AUDIT-C plotted onto a y-axis of log10-transformed values. Within the at-risk group, middle-age adults had significantly higher PEth levels compared with older adults (p < 0.05).