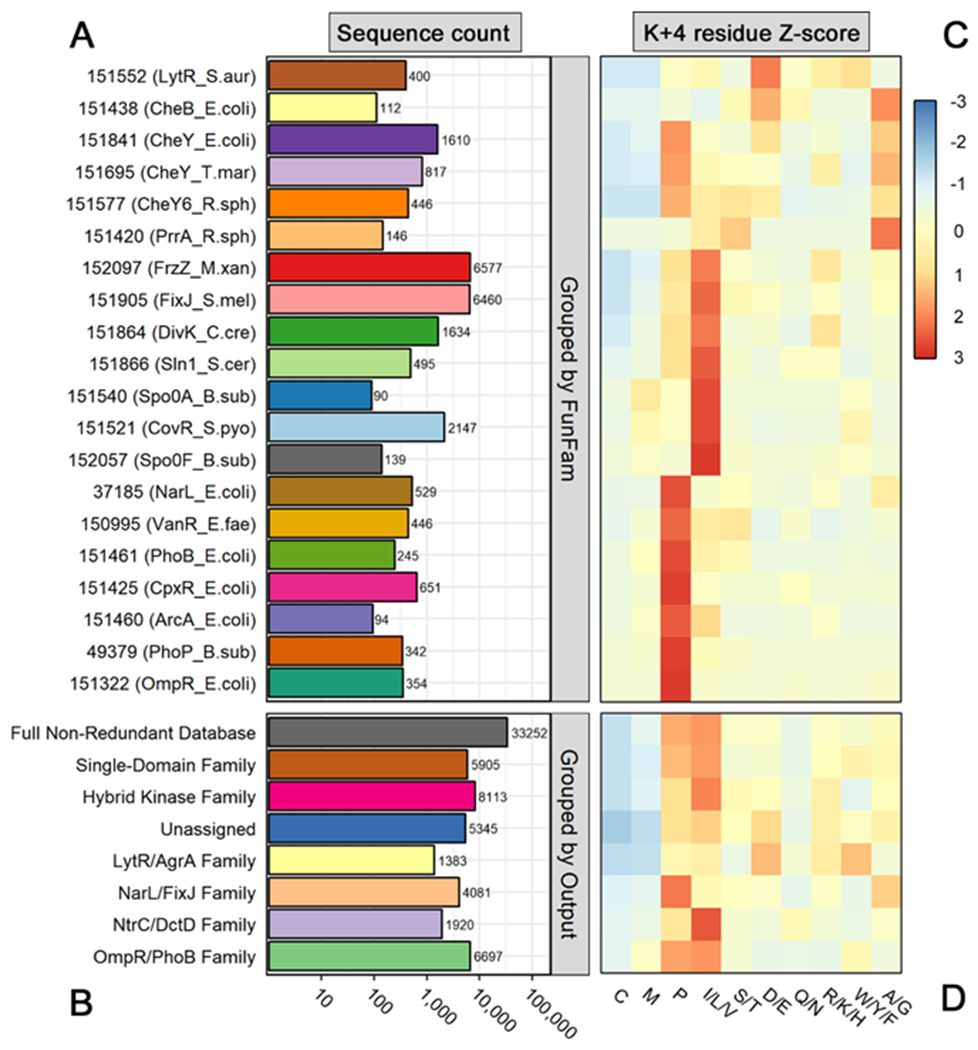
Figure 1. Sequence group sizes and amino acid distributions for residue position K+4 in a non-redundant receiver domain database.

(A) Total number of sequences in each Functional Family (FunFam). Row numbers indicate CATH database FunFam codes (v.4.2.0). Relevant reference rec domain names and organisms are included in parentheses. (B) Total number of sequences in each rec domain subfamily, based on attached output domain. Note that A and B share a common logarithmic scale. (C) Heatmap showing distribution of amino acids at position K+4 of rec domains within each FunFam. (D) Heatmap showing distribution of amino acids at position K+4 of rec domains within each subfamily, based on attached output domain. Residues with similar physiological properties were combined for visualization purposes. Distributions were scaled by row (z-score) to highlight intra-family differences. Residue types with enrichment are colored red, while those with depletion are colored blue. Residue types capturing the row average are colored yellow.
