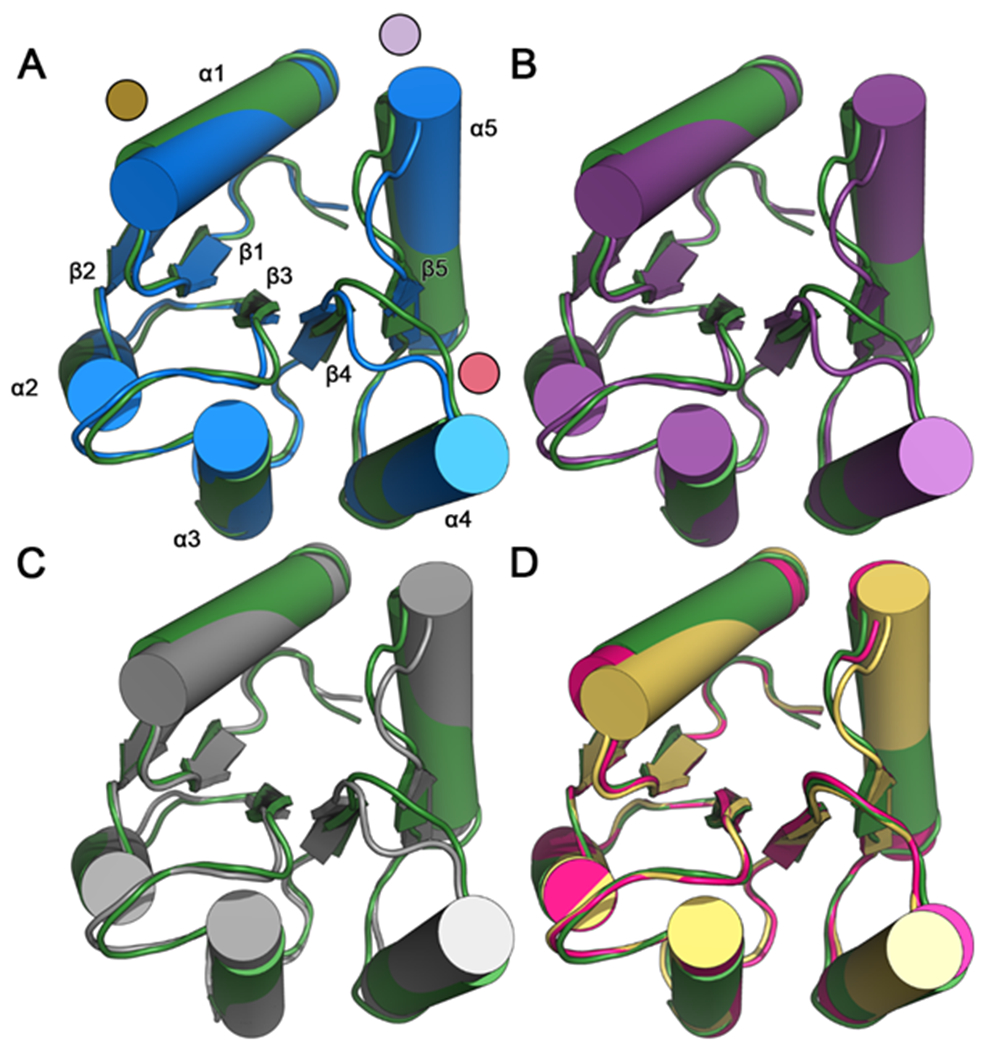
Figure 2. Comparisons of backbone conformations of E. coli CheY in various states reveals activated features of CheY A113P.

Structure-based alignment of inactive wild-type CheY (PDB ID: 3CHY; green) as a reference with: (A) active wild-type CheY•BeF3−•Mn2+ (PDB ID: 1FQW; blue; due to nearly identical backbone conformations, only one protomer is shown). Areas of the highest deviation are denoted with colored discs (gold: α1 helix; red: β4α4 loop; light purple: β5α5 loop and N-terminus of α5 helix). Each of the (βα)5 secondary structures are labeled; (B) active CheY A113P•BeF3−•Mn2+ (PDB ID: 3MYY; purple; due to nearly identical backbone conformations, only one protomer is included); (C) CheY A113P•Mn2+ in the presence of sulfate (PDB ID: 3OO0; grey; due to nearly identical backbone conformations, only one protomer is included); (D) two separate protomers of CheY A113P•Mg2+ in the absence of sulfate (PDB ID: 3OO1; pink and yellow). Note that structures 3CHY, 1FQW, and 3MMY all were determined from crystals in the P212121 space group, whereas 3OO0 was from P3221 and 3OO1 was from P21.
