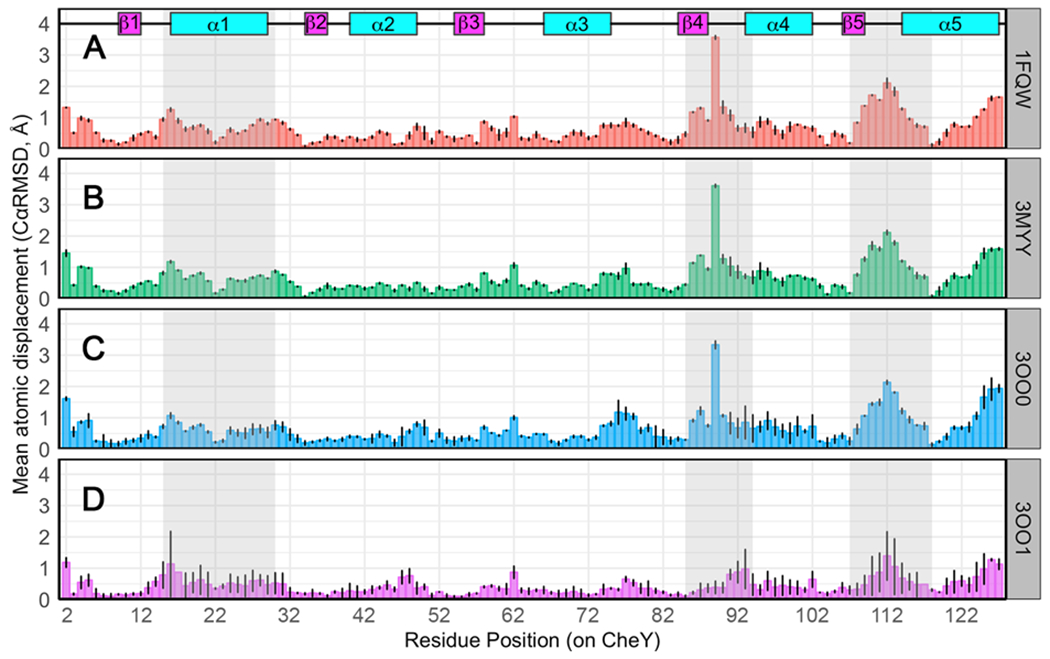
Figure 3. Per-residue structural differences between E. coli CheY models and the inactive state.

Cα deviations (Å) for each residue pair in the corresponding structural comparison. Deviations averaged over all protomers in each structure are shown. Black lines indicate ranges observed. Secondary structures are annotated at the top. Grey shaded regions indicate functional areas known to be dependent on phosphorylation state. Comparison of inactive wild-type CheY (PDB ID: 3CHY; green) as a reference with: (A) active wild-type CheY•BeF3−•Mn2+ (PDB ID: 1FQW); (B) active CheY A113P•BeF3−•Mn2+ (PDB ID: 3MYY); (C) CheY A113P•Mn2+ in the presence of sulfate (PDB ID: 3OO0); (D) two protomers of CheY A113P•Mg2+ in the absence of sulfate (PDB ID: 3OO1).
