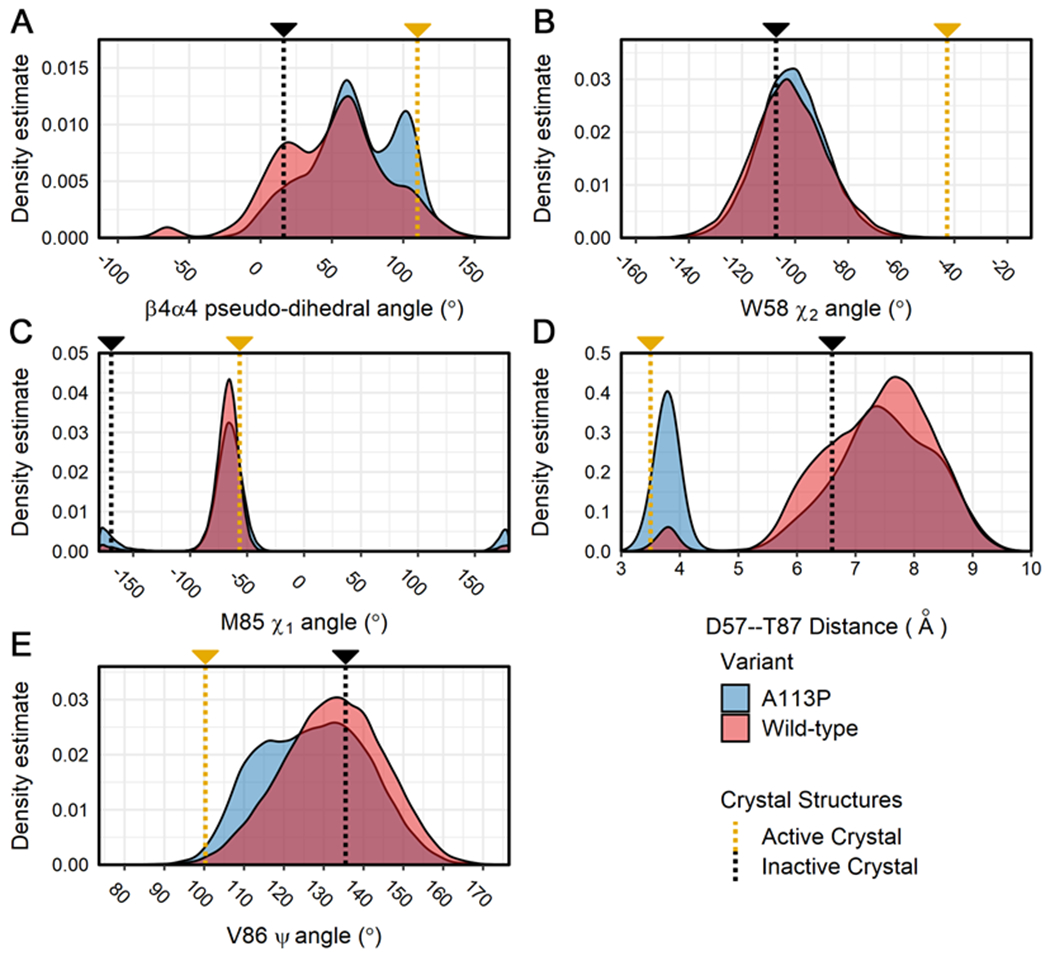
Figure 4. Distribution of values for key structural features related to activation state in the simulations of CheY variants.

Calculations were performed on all replicates for the wild-type and A113P simulations. Density distributions were generated from each separate ensemble data set (blue = CheY A113P, red = wild-type CheY) for the following structural features: (A) the pseudo-dihedral angle of the β4α4 loop (Cα atoms of residues T87:A88:E89:A90), (B) the χ2 angle for the indole side chain of W58, (C) the χ1 angle for the hydrophobic side chain of M85, (D) the interatomic distance between the side chains of D57 (Cγ; replaced with Be in the active crystal structure) and T87 (Oγ1), (E) the Ψ backbone torsion angle of V86. Measurements for existing high-resolution crystal structures are shown on each plot for reference (gold = active CheY, PDB ID: 1FQW; black = inactive CheY, PDB ID: 3CHY).
