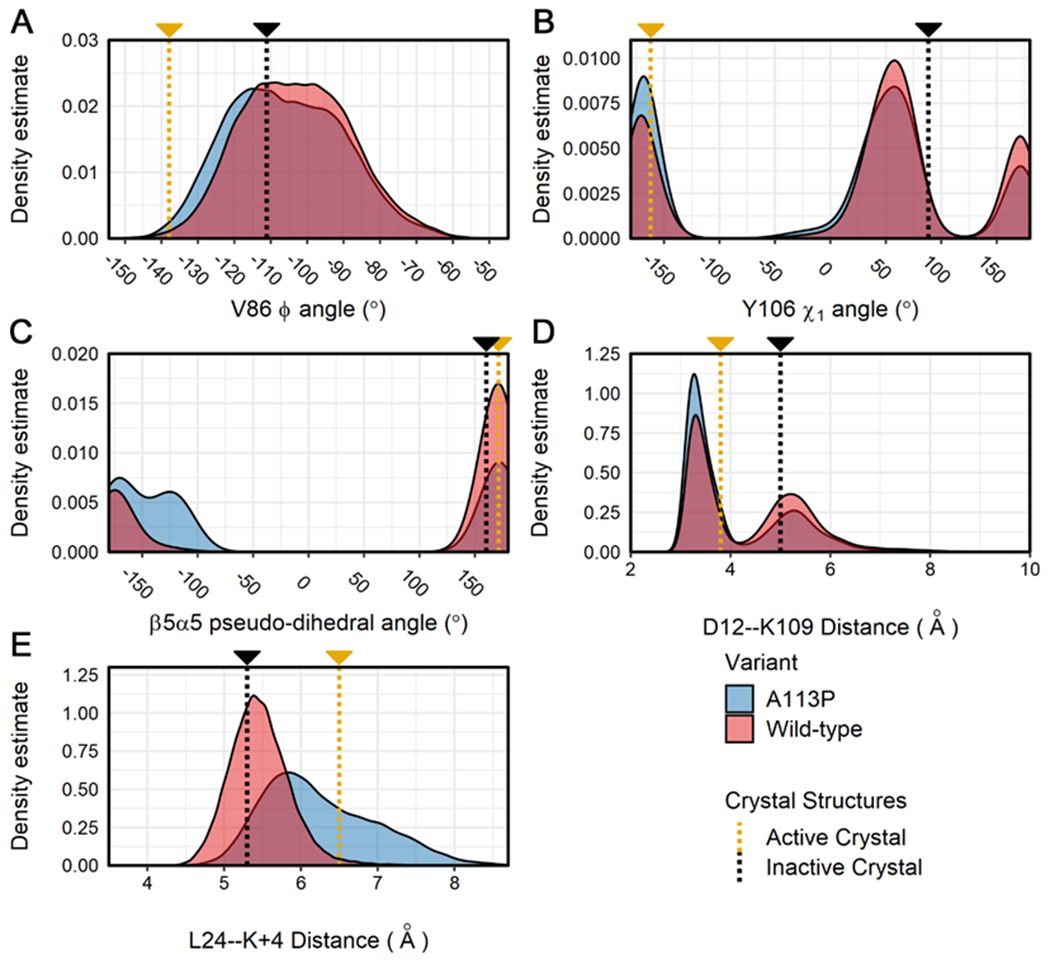
Figure 5. Distributions for additional structural features related to activation state in the simulations of CheY variants.

Calculations were performed on all replicates for the wild-type and A113P simulations. Density distributions are displayed for each ensemble data set (blue = CheY A113P, red = wild-type CheY) for the following structural features: (A) the Φ backbone torsion angle of V86, (B) the χ1 angle for the aromatic side chain of Y106, (C) the pseudo-dihedral angle of the β5α5 loop (Cα atoms of residues K109:P110:F111:T112), (D) the interatomic distance between the side chains of metal-binding D12 (Cγ) and K109 (terminal Nζ), (E) the interatomic distance between the β5α5 loop (Cα of position 113) and the α1 helix (Cα of L24). Measurements for existing high-resolution crystal structures are shown on each plot for reference (gold = active CheY, PDB ID: 1FQW; black = inactive CheY, PDB ID: 3CHY).
