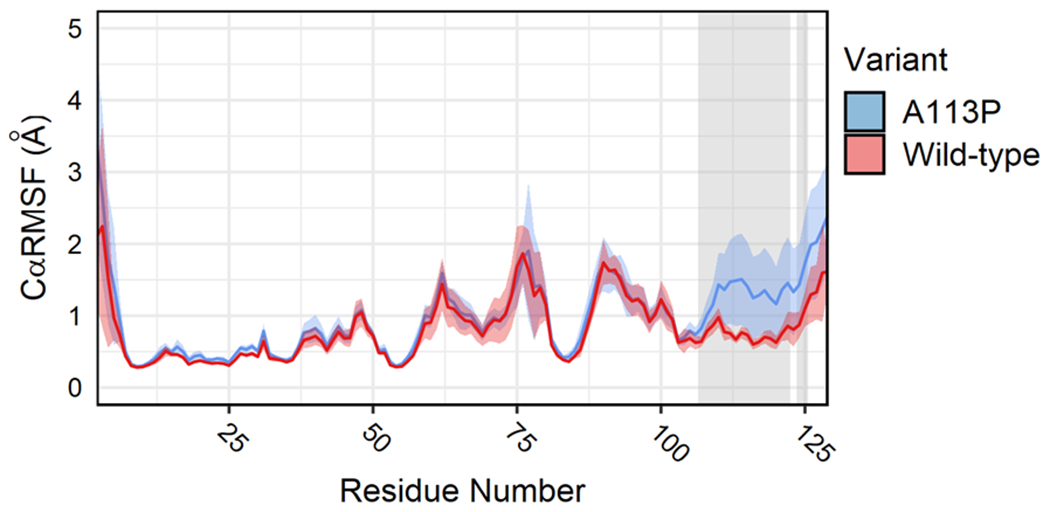
Figure 6. Average CαRMSF for CheY variants during simulation.

Per-residue CαRMSF was calculated across production replicates to quantify atomic fluctuations during the simulations. Solid lines indicate ensemble averages. Colored shaded regions represent standard deviations of the mean (one frame = 20 ps; blue = CheY A113P, red = wild-type CheY). Grey shaded areas indicate regions of statistically significant differences detected between the two CheY variants (two-tailed t-test, p < 0.01, minimum mean difference > 0.15 Å).
