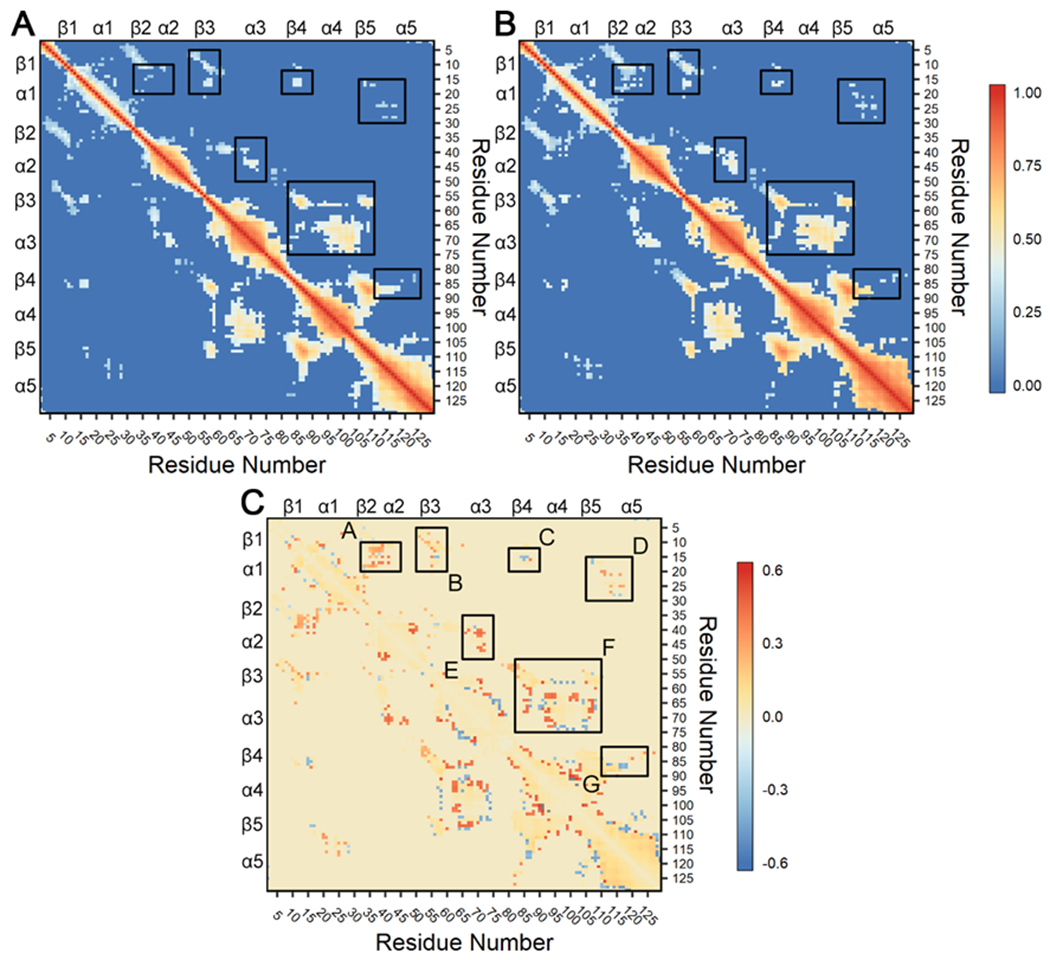
Figure 7. Consensus cross-correlation matrices for each CheY variant ensemble.

Calculations were performed on all replicates for the wild-type and A113P simulations and filtered with a consensus contact map as described in 73, 75, 89. Briefly, analysis used linear mutual information between Cα atoms to create a covariance matrix for each CheY variant.74 Correlations ≥ 0.30 in all twelve replicates were retained as reliable couplings. All other correlations ≥ 0.30 in at least one replicate were excluded if the respective Cα atoms were separated by > 10 Å in 60% of cumulative frames in each replicate trajectory. Correlations failing to meet these requirements were set to zero. Additional cutoffs were examined with similar findings. (A) Correlation observed in the wild-type CheY simulations. (B) Correlation observed in the CheY A113P simulations. In both panels, positive values (red) indicate strongly correlated regions. (C) Difference matrix (B – A) showing changes in dynamical cross-correlation caused by the A113P substitution. Positive values (red) indicate stronger correlation in the A113P variant compared to wild-type CheY, while negative values (blue) indicate weaker correlation. Black boxes highlight areas with differences in correlation between residues in distinct secondary structures, indicating potential functional significance. Note that panels A and B share a common scale (0 to 1), while panel C uses a separate scale (−0.6 to +0.6).
