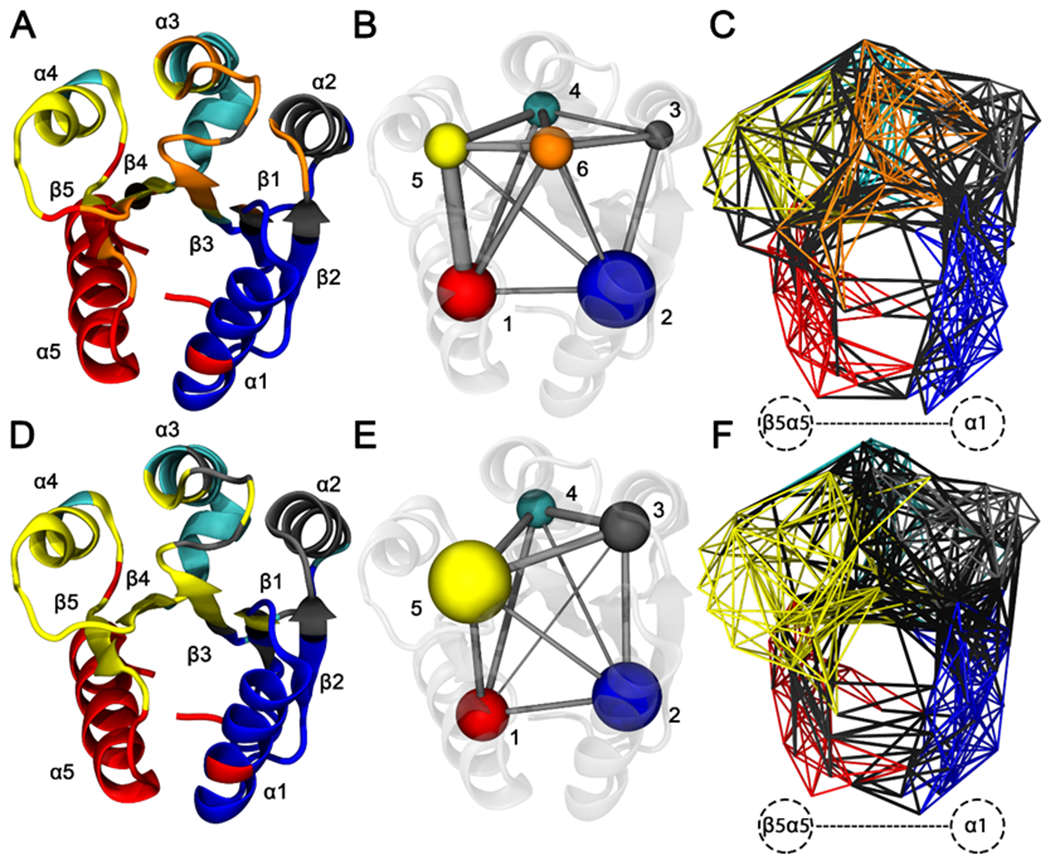
Figure 8. Residue community analysis for CheY wild-type and A113P variants.

Calculations were performed using the filtered consensus LMI matrices. Residue Cα atoms were represented by network nodes. Pairs of nodes were connected by edges weighted by the correlation between the corresponding residues. Community detection was performed using the Girvan-Newman betweenness clustering algorithm. Residues were color coded based on optimal community membership. Wild-type CheY is shown in the top row, and CheY A113P is shown in the bottom row. (A and D) Cartoon diagram of wild-type CheY, with secondary structures colored based on residue community assignments. (B and E) Simplified schematics showing differences in residue network topologies. (C and F) All-residue depictions showing full network connectivity. Colored edges indicate intracommunity couplings. Black edges indicate intercommunity couplings. Labeled region in panels C and F show substantially altered interactions between the β5α5 region and the α1 helix.
