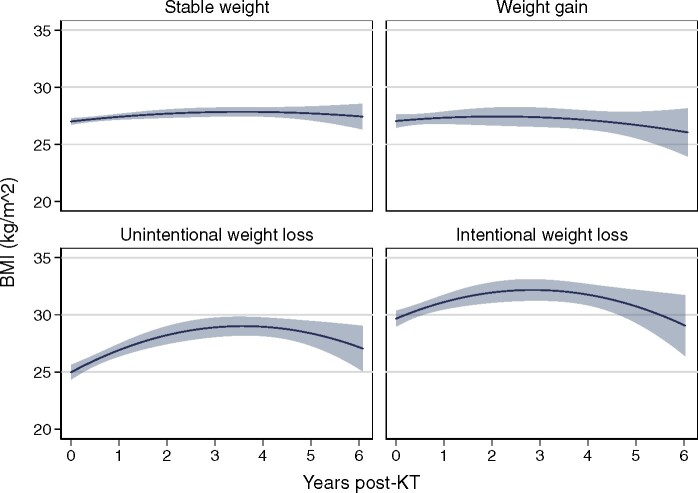
FIGURE 2.
Unadjusted estimates of post-KT BMI trajectories by pre-KT weight change in the year prior to KT (N = 919). Estimated BMI with 95% CIs are presented from quadratic prediction plots. Intentionality of weight loss was measured among recipients who experienced weight loss >5% within 1 year prior to KT and stable weight was defined as weight change in 1 year prior to KT ≤5%.

