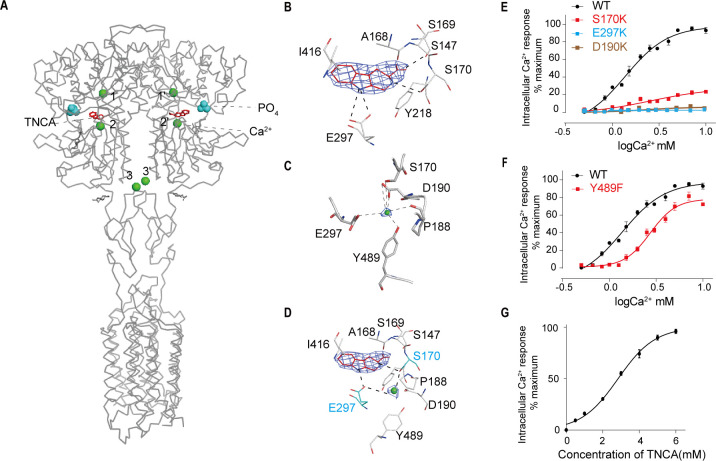
Figure 3. Ca2+ and TNCA as a composite agonist activate the full-length CaSR dimer directly.
(A) Ribbon representation of the active CaSR (gray), showing the location of the Ca2+-binding sites (green sphere) and TNCA (red). (B) Specific contacts between CaSR (gray) and TNCA (red space-filling model), mesh represents the final density map contoured at 17σ surrounding. (C) Specific interactions between CaSR and newly identified Ca2+ ion (green sphere), the mesh represents the cryo-EM density map contoured at 6.0σ surrounding Ca2+. (D) Highlighting the newly identified Ca2+ and TNCA sharing two common binding residues S170 and E297 (cyan space-filling model). (E) Dose-dependent intracellular Ca2+ mobilization expressing WT (black dots), mutant S170K (red dots), E297K (cyan dots), and D190K (brown dots) of CaSR. The single mutations were designed based on Ca2+ binding sites. N = 4, data represent mean ± SEM (Figure 3—source data 1). (F) Dose-dependent intracellular Ca2+ mobilization expressing WT (black dots), mutant Y489K (red dots) of CaSR. The single mutation was designed based on Ca2+ binding sites. N = 4, data represent mean ± SEM (Figure 3—source data 1). (G) Dose-dependent TNCA-activated intracellular Ca2+ mobilization in response to 0.5 mM Ca2+ ions. N = 3, data represent mean ± SEM (Figure 3—source data 2).
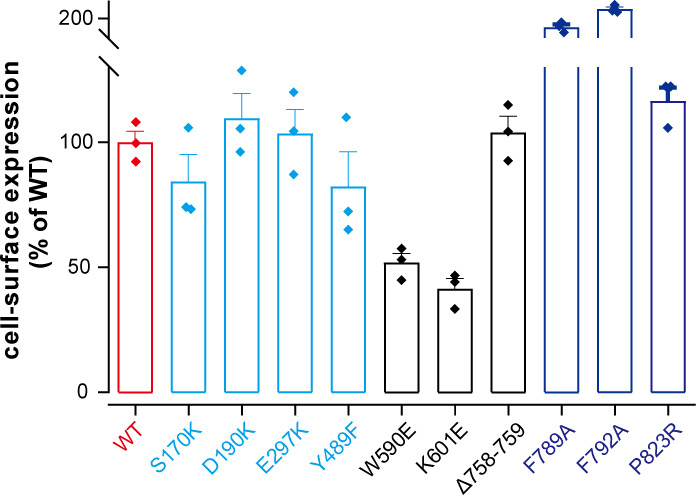
Figure 3—figure supplement 1. Cell surface expression.


