. 2021 Aug 31;10:e70948. doi: 10.7554/eLife.70948

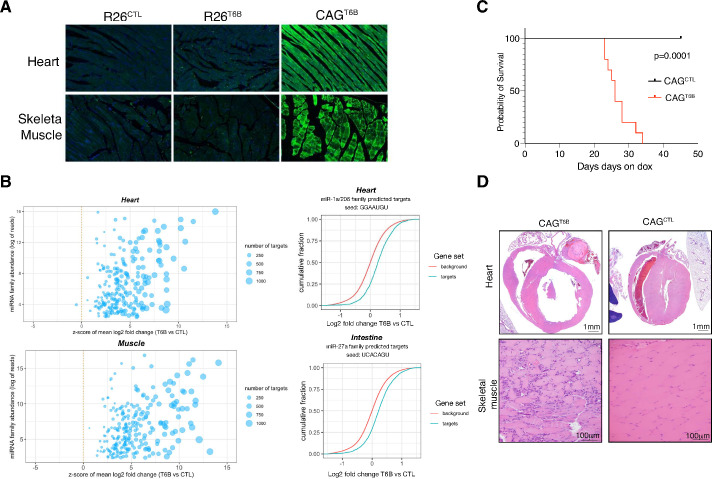
Figure 6. The microRNA (miRNA) pathway is essential in heart and skeletal muscle during homeostasis.

(A) Detection of T6B expression with an anti-YFP antibody in the heart and skeletal muscle of R26T6B, CAGT6B, and R26CTL mice maintained on doxycycline-containing diet for 7 days. (B) Total RNA extracted from the heart (upper panel) and the skeletal muscle (lower panel) of CAGCTL and CAGT6B mice (n = 3 for each strain) maintained on dox for 7 days was analyzed by RNAseq. Left panels: scatter plot showing the effect of T6B expression on targets of conserved miRNA families was generated as described in Figure 1D. The abundance of each miRNA family was calculated using dataset from Isakova et al., 2020. Right panels: representative cumulative distribution plot of log2-fold changes in expression of predicted targets of the indicated miRNA families. (C) Kaplan–Meier curves of CAGT6B and CAGCTL mice (n = 8 for each genotype) maintained on doxycycline throughout the duration of the experiment. p-Value from log-rank test. (D) Upper row: representative H&E staining showing marked dilation of the four cardiac chambers in hearts of CAGT6B mice compared to controls (n = 9 for each genotype). Despite having thinner walls, the histomorphology of ventricular cardiomyofibers was within normal limits. Bottom row: representative H&E staining showing degenerative and regenerative changes in the skeletal muscle of the hind limbs of CAGT6B mice compared to controls (n = 9 for each genotype).

Figure 6—source data 1. RNAseq, heart and muscle.
Figure 6—source data 2. Z-scores and miRNA family abundance, heart and muscle.

Figure 6.

Figure 6—figure supplement 1. Body weight of CAGT6B and control mice maintained on doxycycline for up to 45 days was assessed the day on which euthanasia was performed.
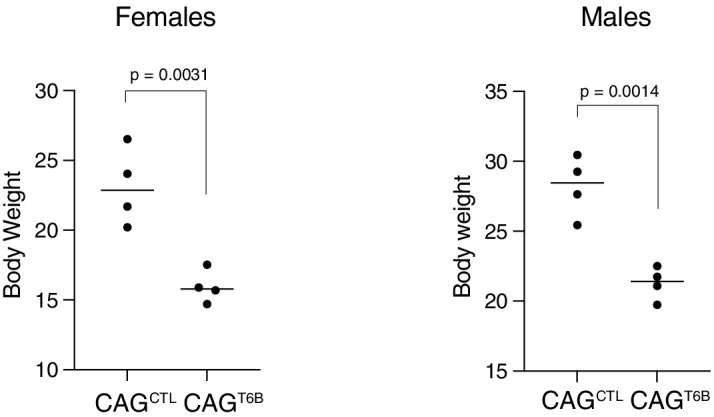
Figure 6—figure supplement 1.

n = 8 (four females and four males) for each genotype (age and sex matched). Mice were kept on doxycycline diet throughout the duration of the experiment, and control mice were euthanized at day 45. P-values: unpaired t-test.
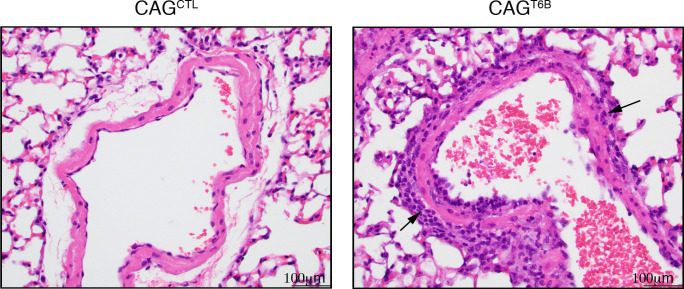
Figure 6—figure supplement 2. Representative H&E staining showing vasculitis of the pulmonary veins as revealed by inflammatory immune cell infiltration of the vessel wall (arrows).

Figure 6—figure supplement 2.

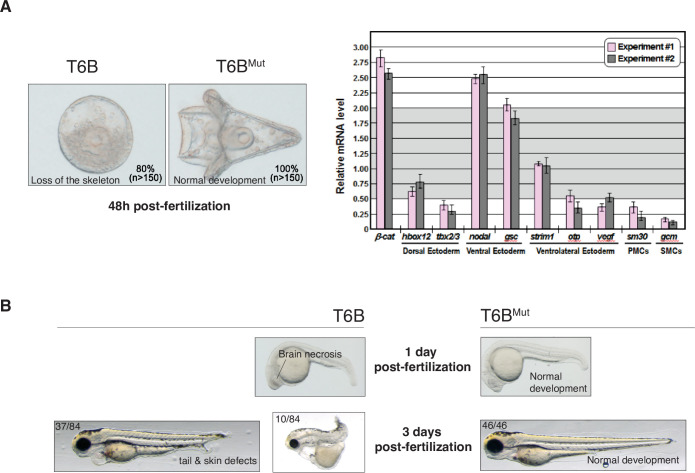
Figure 6—figure supplement 3. T6B blocks miRNA activity in sea urchins and zebrafish.

Figure 6—figure supplement 3.

(A) Left panel: representative examples of Mediterranean sea urchin (Paracentrotus lividus) zygotes injected with 1 pg of in vitro-transcribed mRNA coding for either T6B or T6BMut proteins and observed under DIC optics at 48 hr post-fertilization. Both embryos are oriented in a vegetal view. T6B-expressing embryos displayed severe developmental aberrations ranging from the failure to form a proper archenteron and skeletal structures, to overall delay in development and embryonic lethality. By contrast, control T6BMut-expressing embryos observed at the same developmental stage went through embryogenesis normally and exhibited the characteristic easel-like shape of the echinoid pluteus larva. Right panel: quantitative PCR showing dysregulation of territorial marker genes involved in the developmental gene regulatory network of the sea urchin (Cavalieri and Spinelli, 2015a, Cavalieri and Spinelli, 2015b) upon T6B expression. Data are indicated as fold difference in transcript abundance with respect to control T6BMut-expressing embryos at the same stage of development. The gray region represents changes in mRNA abundance corresponding to less than threefold difference, while error bars are standard errors for the qPCR replicates. PMCs: primary mesenchyme cells; SMCs: secondary mesenchyme cells. (B) Zebrafish (Danio rerio) fertilized eggs were injected with 75 pg of in vitro-transcribed mRNA coding for either T6B or T6BMut fusion proteins. While T6BMut-expressing embryos developed normally, the majority of T6B-expressing embryos underwent severe developmental defects.